According to the National Retail Federation, more than 8,100 retail store locations opened in 2021, and that’s just in the US. Whether these were new brand openings, brand expansions, or store relocations, this stat indicates just how much POIs change every day. At a global scale, these changes are challenging to stay ahead of, and many companies building mapping and location-based platforms or applications struggle to curate an accurate and up-to-date database of places.
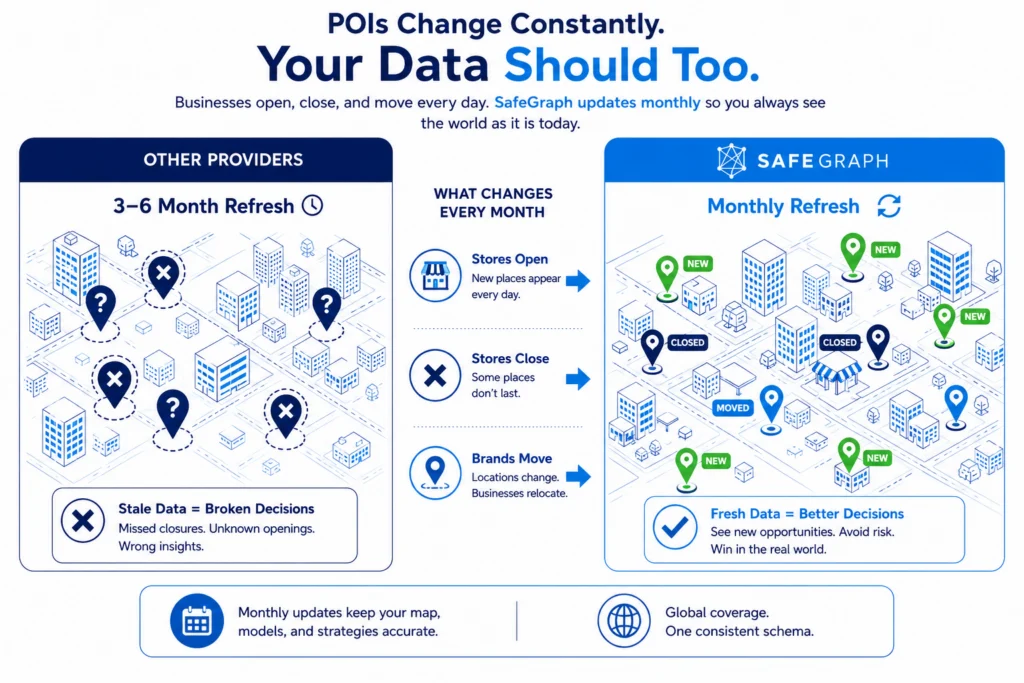
When point of interest (POI) data is an integral part of an organization’s operations, the risk associated with such a significant gap in database updates is high. A company that relies on an up-to-date record of places for its trade area analysis, for example, risks building catchments based off of incorrect competitor locations, thus misallocating resources if using stale data. Similarly, a consumer-facing mapping application built with outdated POI data makes for a poor user experience and creates a high churn rate. For a fuller picture of how organizations put this data to work, see Points of Interest Data: 5 Common Use Cases Across Industries.
Working with stale and inaccurate data is also highly inefficient. According to research by Gartner, poor data quality costs large corporations nearly $15 million per year in losses, both in time and resources. Modern data scientists spend approximately 19% of their time collecting baseline data and 60% of their time cleaning and organizing it. With the majority of time spent remediating ‘dirty data,’ companies can drastically reduce operational data costs by simply obtaining high-quality data from the start, or by evaluating whether to build or buy POI data in the first place.
This need for fresh and reliable POI data is why SafeGraph was founded in 2016, and we remain focused on one thing only: being the source of truth for physical places. The SafeGraph Places dataset is curated each month to empower organizations with an up-to-date view of global market landscapes, brand relationships, and how places share physical spaces.
What is SafeGraph Places Data?
SafeGraph Places is a comprehensive dataset composed of high-quality points of interest (POIs), leveraged by thousands of organizations globally who trust the data as their primary source of truth. It’s a database created to address the most pressing challenges involved with POI data collection and upkeep, providing data scientists, product managers, and analysts with accurate and timely location information to ensure their products, services, analytics, and strategies are built on real-world facts. Places contains a robust set of geospatial attributes to provide deep context about physical locations, including address string, geographic coordinates, brand affiliation, open/close date, and NAICS/category codes. For more on why data teams choose this approach, see 6 Reasons Why Data Scientists Choose SafeGraph Data.
An advantage of SafeGraph’s Places dataset is the breadth of location types included. While many POI data providers only provide traditional commercial places, such as restaurants and retail stores, SafeGraph additionally curates POI data for parks, warehouses, EV charging stations, oil rigs, and other important, non-traditional places, all covered in detail in Everything You Need to Know About Industrial POIs. This comprehensive coverage of global places under one unified data schema enables efficient data ingestion, modeling, and analysis, eliminating the need to prep data from multiple sources.
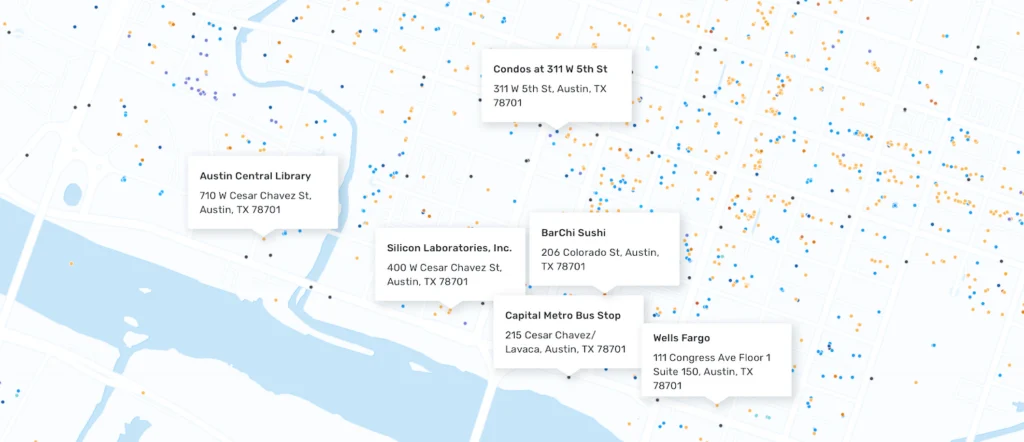
SafeGraph Places provides a comprehensive view of what POIs exist in an area, including non-traditional places like corporate offices, bus stops, and apartment complexes.
SafeGraph’s data curation process ensures the POIs included in Places are geographically precise and contain fresh and accurate attributes about what is actually occurring at that place. In the next section, we’ll dive into our data curation methodology and how we maintain freshness in a changing world.
How Does SafeGraph Curate the Places Dataset Each Month?
Each month, SafeGraph creates the Places dataset using machine learning (ML) technology, web crawling, and third-party licensing, all detailed in SafeGraph’s Data Sourcing Process. More specifically, SafeGraph curates POIs by:
- Passing POI metadata through machine learning models to assign relevant business categories, deduplicate POIs within and across sources, and cleanly parse addresses.
- Crawling open-source web domains and store locators for accurate and up-to-date place locations.
- Using publicly available APIs to provide updated locations for specific categories of POIs such as airports and government buildings.
- Licensing third-party data to fill open gaps in POI data.
The combination of all these sources results in a ready-to-use, clean, and current dataset that reflects the current state of points of interest around the world.
What Fields Make Up the Places Data Schema?
Each column in the Places data schema is designed to provide relevant and up-to-date information about global POIs. We describe each column in more detail below:
Schema Field Reference Table
Field | Type | Description |
|---|---|---|
String | Unique, persistent POI identifier (Placekey standard); present on every record | |
String | Placekey of the enclosing place (e.g. mall, airport); null if standalone | |
location_name | String | Name of the point of interest (always populated) |
List | Brand name(s) if POI is an identified brand instance; null for independents | |
List | Unique, persistent brand ID(s); stable across renames; encodes parent–child hierarchy | |
street_address, city, region, postal_code, iso_country_code | String | Parsed address elements; region uses ISO 3166-2 subdivision codes |
Float | Geographic coordinates of the POI | |
store_id | String | Brand-issued store identifier; useful for joining to transaction or financial data |
phone_number | String | E.164-formatted phone number for the POI |
JSON | Day-keyed opening and closing times in the POI’s local time | |
website | String | URL of the POI’s publicly available website |
String | 4- or 6-digit 2017 NAICS code (e.g. 722513 for limited-service restaurants) | |
top_category | String | Label for the first 4 NAICS digits (e.g. Restaurants and Other Eating Places) |
sub_category | String | Label for all 6 NAICS digits (e.g. Limited-Service Restaurant); null if 4-digit only |
JSON | Granular, multi-value tags beyond NAICS (e.g. Drive-Through, Late-Night, Counter Service) | |
String | Year-month the POI opened (yyyy-mm format); null if unknown | |
closed_on | String | Year-month the POI closed; null means the POI is currently open |
tracking_closed_since | String | Month SafeGraph began tracking open/close status for this POI |
String | POLYGON or POINT, whether the POI has a measurable physical footprint |
Want to see these fields in practice? Download a free Global POI Sample
STARTER NOTEBOOK – SafeGraph Core Places – Starter Notebook (Google Colab) |
Placekey & Parent Placekey
SafeGraph is a founding member of Placekey, the universal standard unique identifier for places. Placekey was developed out of a need to make location datasets from different sources easily joinable. To make sure our data is interoperable with other location data, SafeGraph appends Placekeys and parent Placekeys to all of our datasets.
Within SafeGraph Places, the Placekey and parent Placekey columns help identify the physical location of a POI and how it is spatially related to other places. When both components of a Placekey come together, it results in the ‘what’ and the ‘where’ of a specific POI and serves as a join-key to simplify bringing multiple location-based datasets together.
Placekey is a unique and persistent ID tied to an individual POI that simplifies joining location-based datasets from multiple sources. Think of a Starbucks location inside of a shopping mall, that Starbucks will have a unique Placekey because of its geographic location and the type of place it is. Each record in the Places dataset contains a Placekey.
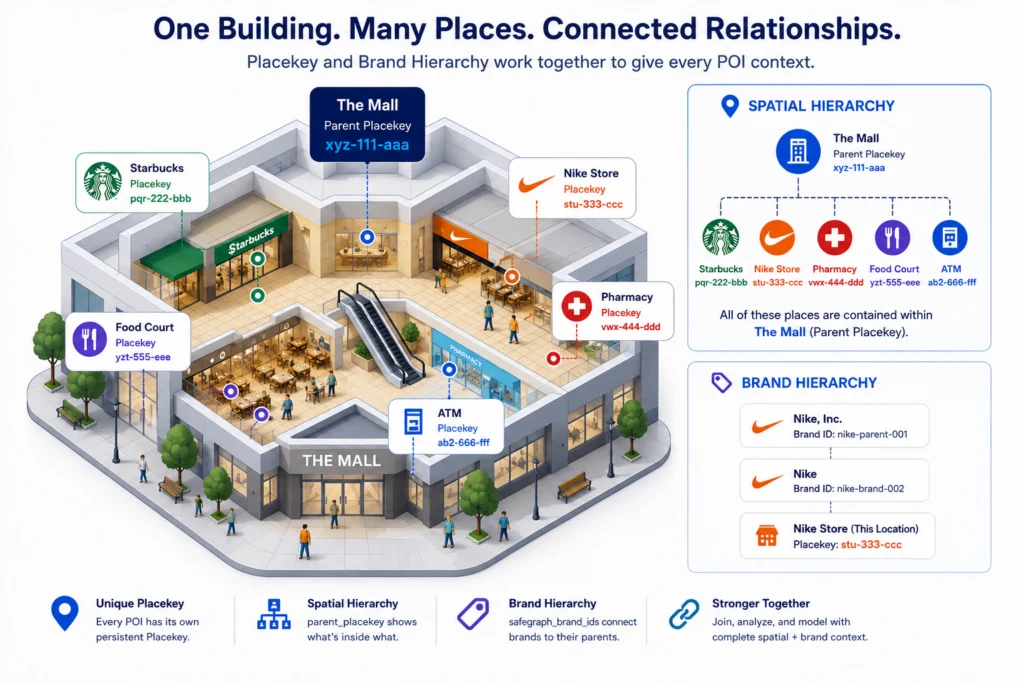
The parent Placekey column, on the other hand, is only populated in rows representing places that are contained by another place. Using the previous example, the Starbucks store inside the mall will have both a Placekey and a parent Placekey, where the Placekey represents the store itself, and the parent Placekey represents the entire shopping mall. This concept of representing how places are related to each other physically is what we call ‘spatial hierarchy.’ Spatial hierarchy metadata appended to SafeGraph Places indicates when a place is standalone, exists within a larger structure, or shares a physical location with another place. Read more about these nested relationships in Working With Locations Inside Other Locations.
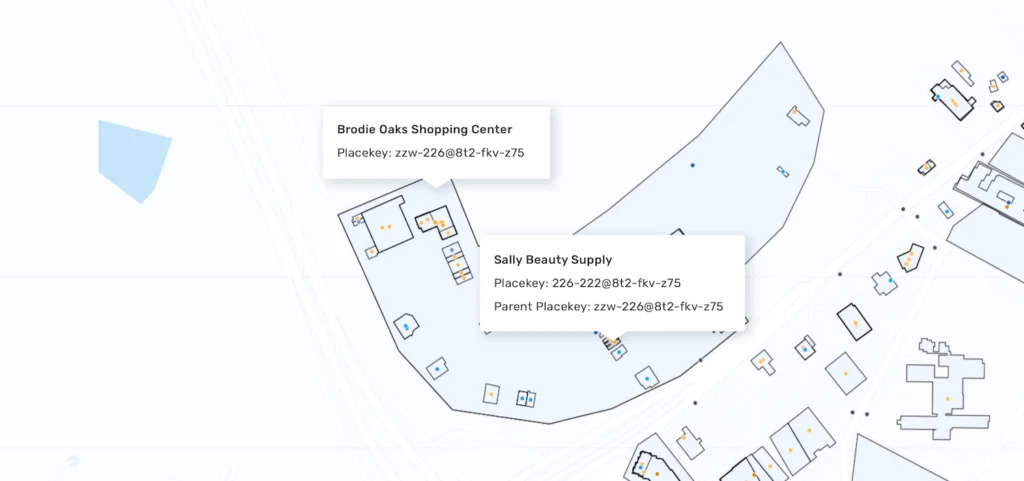
Placekey and Parent Placekey denote spatial hierarchy (how places relate to each other), such as a store within a mall.
Location Name, Brands, & SafeGraph Brand ID
To provide the base information about what exists at each geographic location, SafeGraph includes three closely related columns. The location name column delivers the unique name of each place, such as 7-Eleven. Sometimes this matches the value in the brands column, particularly when a location name is simple, like Walmart, and falls under the Walmart brand. However the location name column can differentiate between a Walmart and a Walmart Supercenter, while the brand for that location will still be just Walmart.
The brands field is helpful for seeing entire brand footprints regardless of whether individual locations have different naming conventions. SafeGraph brand IDs also help surface brand relationships by serving as a unique and persistent identifier for different brands. Brand IDs remain the same in the event of a brand renaming itself so as not to break any existing models or queries. For a deeper look at why this matters, see Three Reasons Why Brand Attribution Is Essential to POI Data.
SafeGraph brand IDs also detail parent and child brands. Similar to Placekey denoting spatial hierarchy, SafeGraph brand IDs show brand hierarchies. For example, Yum! Brands own multiple restaurant brands, so POIs for those restaurant brand locations will contain a brand ID for that restaurant, and a parent brand ID for Yum! Brands. This takes identifying brand footprints and market landscapes a step further to show how some brands are related to each other, and provides another field option for querying and modeling places data. Learn more about our global brand coverage in Announcing SafeGraph Global Brands.
Every point of interest (POI) in SafeGraph Places includes a location name, but not all records include a brand or brand ID. This is because many places do not belong to a larger brand, such as independent restaurants or local museums. SafeGraph defines a brand as a branded store which has multiple locations all under the same logo or store banner.
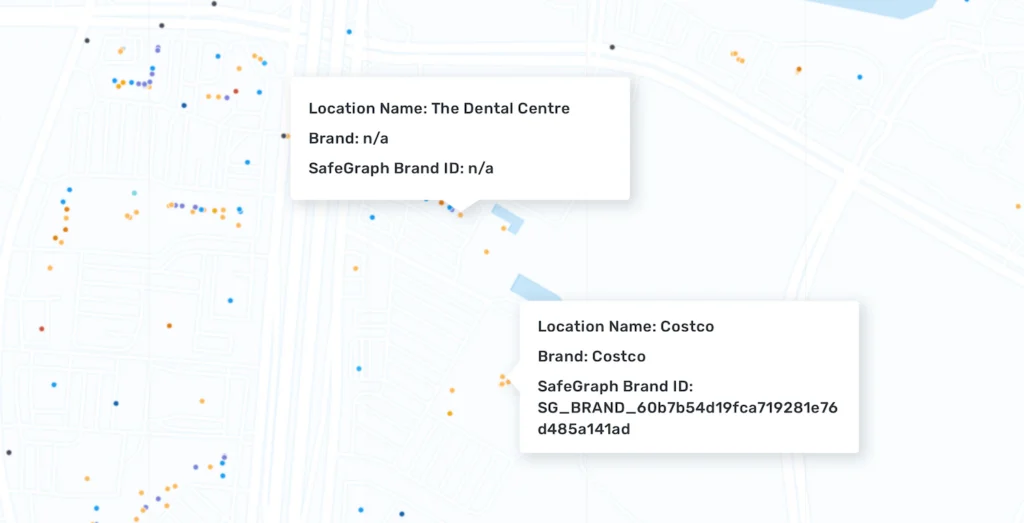
Some columns in the Places dataset only apply to certain types of POIs, like Brand and Brand ID. Smaller mom-and-pop store locations or offices will have ‘null’ values in these columns because they do not belong to a larger brand.
While location name, brands, and brand IDs are included in the main file delivered for SafeGraph Places, we include a supplementary brand info file in each delivery to provide the parent brand ID and more brand-specific information. The brand info file is easily joinable to SafeGraph Places through the brand ID column, and includes brand categorization information, stock symbol, stock exchange presence, and lists of which countries the brand currently has opened and closed locations in.
Address Elements & Geographic Coordinates
The Places dataset includes separate columns for the latitude and longitude of each POI to make the data easily mappable. It also has columns for parsed-out address strings, including separate columns for street address, city, region, postal code, and ISO country code. These foundational columns not only locate the points of interest in the physical world (as does Placekey) but also power geocoding services in mapping applications and serve as valuable filters for selecting POIs from specific geographic areas. For considerations specific to non-US markets, see 5 Technical Differences Between US and UK POIs.
Store ID
Store IDs are unique identifiers within a brand for store locations. The store ID column enables users to easily join with other datasets that include store IDs. Most often, this involves transaction information, financial statements, quarterly reports, and first-party company data.
Phone Number, Open Hours, & Website
To provide further foundational context for each POI, the Places dataset includes three columns related to how people can engage with that place: phone number, website, and open hours. These are particularly useful for mapping applications or platforms that surface information to people looking to interact with a place. The open hours column contains specific hours of operation by day in an easily explorable JSON format.
Top Category, Sub Category, & NAICS Code
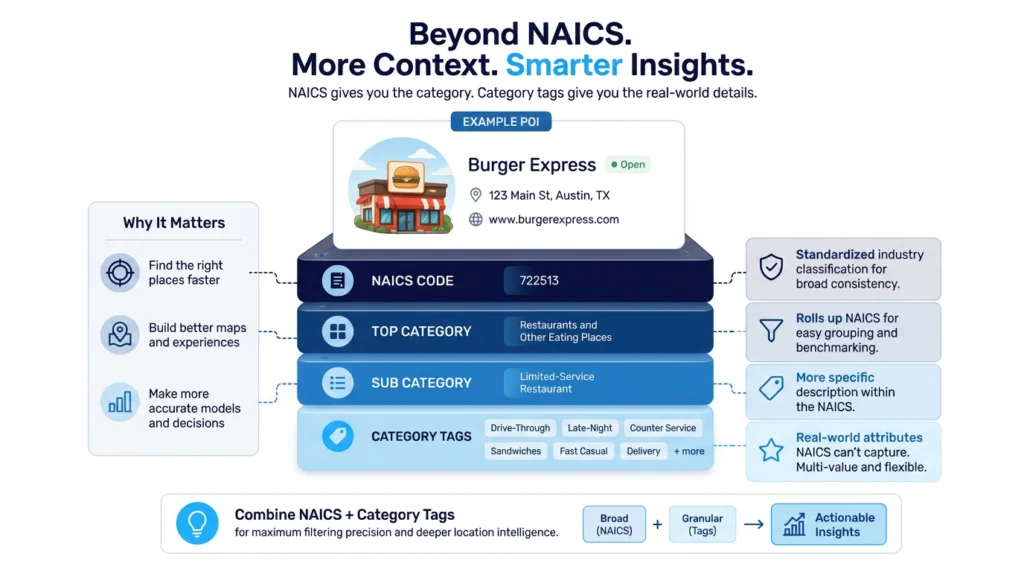
The NAICS code, top category, and sub category columns categorize a point of interest (POI) by what type of place it is. These categorizations were developed by the US Census Bureau to distinguish different place types and are all closely related to each other.
NAICS codes define a POI by a 6-digit code – a taxonomy developed to classify each type of POI numerically. Burger King, a ‘limited-service restaurant,’ contains a NAICS code of 722513. Top category is a string label that defines a POI by its purpose, based on the first 4 digits of a NAICS code. A Burger King, for example, is labeled ‘restaurants and other eating places.’ Sub category is a string label that defines a POI with a description of its purpose, based on the first 6 digits of a NAICS code. The same Burger King location labeled ‘restaurants and other eating places’ in the top category column is labeled ‘limited-service restaurant’ in the sub category column.
SafeGraph strives to provide 6-digit NAICS codes for most POIs, but for some places our models cannot meaningfully differentiate between two adjacent 6-digit NAICS. In these situations we err on the side of caution so as not to provide false facts, and choose to only assign a 3 or 4 digit description, meaning the sub category column will be null.
Category Tags
The category tag column expands on this categorization, providing further flexibility and granularity where the NAICS codes fall short. For example, category tags for a fast food restaurant may include terms like ‘counter service,’ ‘sandwich shop,’ ‘late-night,’ ‘drive-through,’ and more, while the sub category would remain ‘limited-service restaurant’ regardless of the type of food served. Category tags are also helpful in distinguishing between different types of medical offices or retailers.
This information is typically used to:
- Power more detailed and specific search queries
- Create more informative customer-facing mapping applications
- Better understand market landscapes
- Develop more accurate models
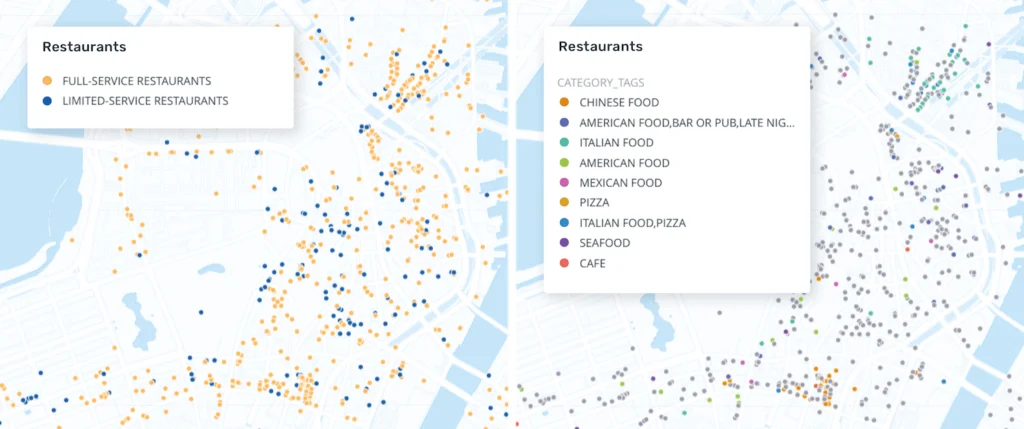
Category tags allow for more granular filtering and symbolizing, and help distinguish place types from each other within the same NAICS code.
Because each POI can contain multiple category tags, category tags are included as JSON in one column if applicable to a specific place. See how richer category and amenity data improves location intelligence in practice.
Opened On, Closed On, & Tracking Closed Since
To indicate the real-world status of a POI and make it clear when places open and close, SafeGraph includes three date-related columns. The opened on column provides the month and year that POI opened, while the closed on column details the month and year that POI closed, if applicable. If a closed on column value is null, that indicates the POI is still open. If an opened on column value is null, it means we are still acquiring the metadata to confidently report when that place opened, or that it opened before we had rich enough metadata to infer a date. We also include a tracking closed since column to note when we began reporting on that place’s opened or closed status.
The SafeGraph product and engineering teams have developed a detailed and thorough logic for determining if POIs are opened or closed. If a new place from an existing source repeatedly appears in our build pipeline, it is flagged as opened during the month in which it first appears. Similarly, if a POI from an existing source repeatedly disappears from our build pipeline, it is flagged as closed during the month in which it first disappears. These flags are added to the Places product permitting final QA checks and overall data hygiene. SafeGraph does not track temporary closures so as not to mistakenly mark places as permanently closed. You can read more about our open and close logic here.
Geometry Type
While SafeGraph Places is ultimately a file of latitude and longitude coordinates for points of interests (POIs), we do provide detail on whether the location itself exists in the real world as a polygonal space or not. For example, while the record for Golden Gate Park in SafeGraph Places is represented as geospatial coordinates for a single point, the geometry type field indicates that the park actually can be represented as a polygon. Types of places that do not have a polygonal geometry type include bus stops or ATMs, since they often do not have physical extents large enough for a person to traverse, you can learn more about this distinction in Introducing Point POIs. SafeGraph uses the Places dataset to build Geometry data, providing the polygon data for places with geometry.
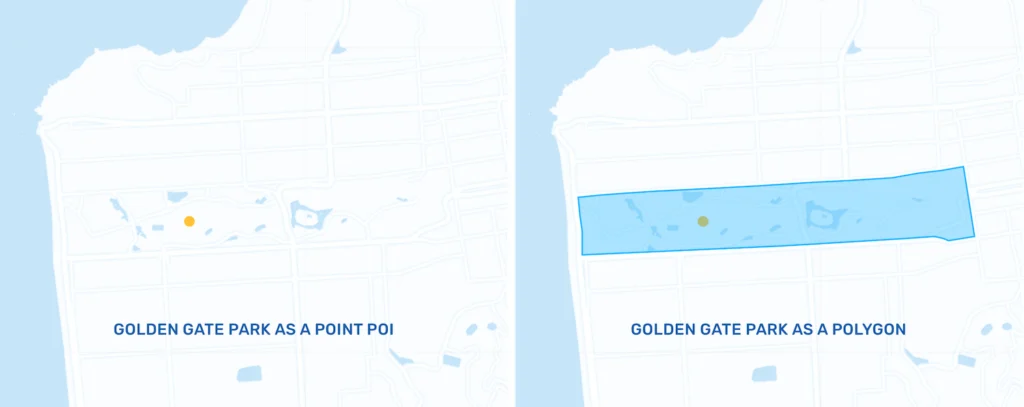
SafeGraph produces a polygon dataset for users who require a more precise understanding of a place’s spatial extent.
Conclusion: Building on a Foundation You Can Trust
The physical world is not static, stores open and close, brands expand and contract, new location types emerge, and the way we define a “place” continues to evolve. Any organization that depends on points of interest (POI) data, whether to power a consumer-facing app, inform a site selection decision, or model competitive landscapes, is only as accurate as the data underneath it.
SafeGraph Places was built around a simple but demanding standard: every POI should be real, current, precisely located, and richly described. That’s why the schema goes beyond a name and a coordinate. The combination of persistent identifiers like placekey and parent_placekey, standardized NAICS categorization, granular category tags, reliable open/close signals, and brand hierarchy gives you a complete, join-ready picture of the world’s physical places, not a patchwork of sources you have to reconcile yourself.
Whether you’re a data scientist building a model, a product manager designing a location feature, or an analyst sizing a market, SafeGraph Places removes the data plumbing problem so you can focus on the work that actually moves the needle. And because the dataset is updated every month, far more frequently than the industry norm, you can trust that what you’re building on reflects the world as it is today, not as it was six months ago.
If you’re evaluating whether to build or buy, want to see how other teams have put Places data to work across industries and use cases, or are simply ready to get your hands on the data, SafeGraph is a good place to start.