Why leading developers choose SafeGraph data
How we support your innovations
Reasons Why Data Scientists Choose SafeGraph Data
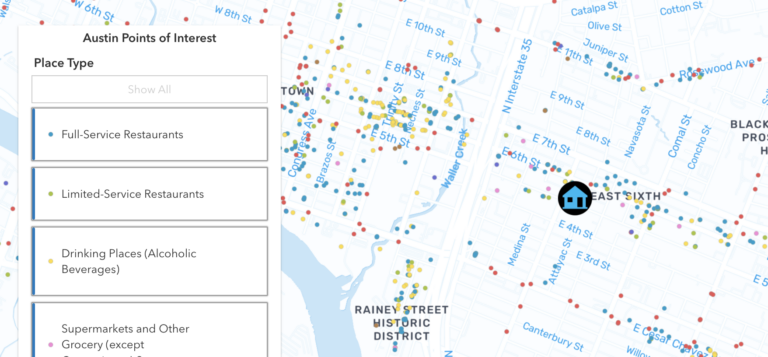
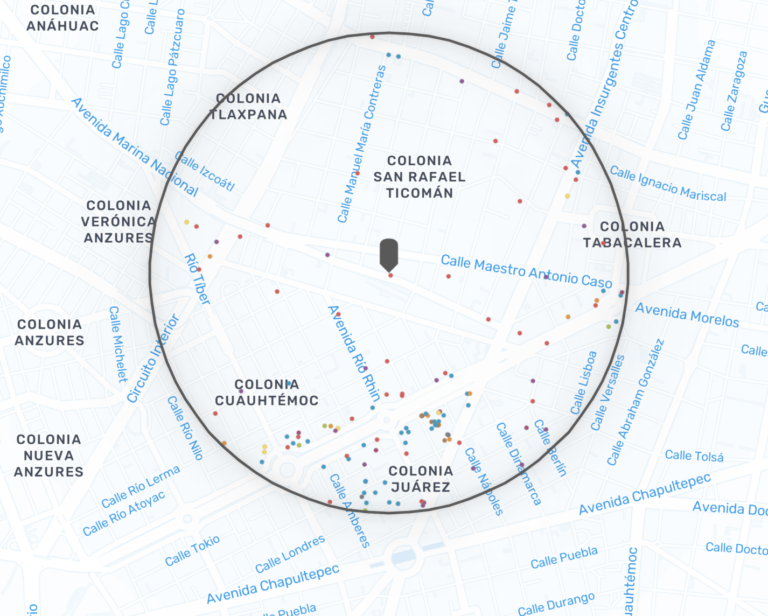
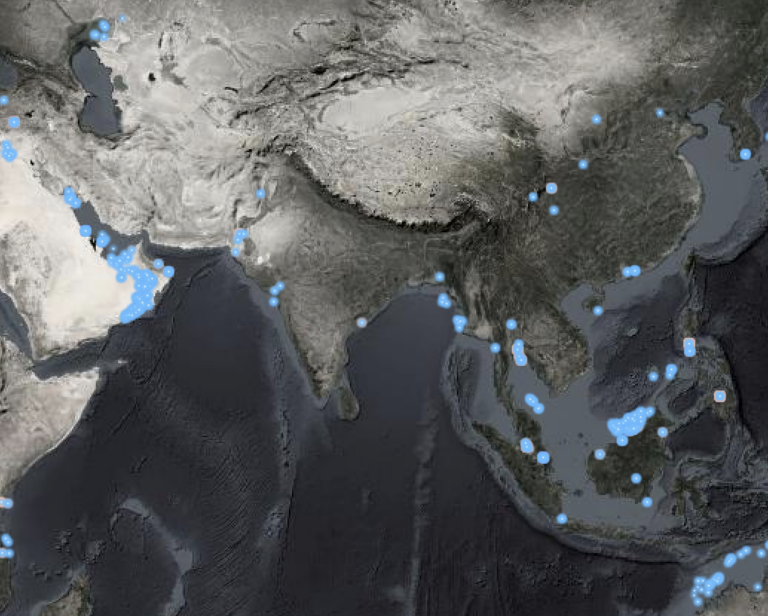
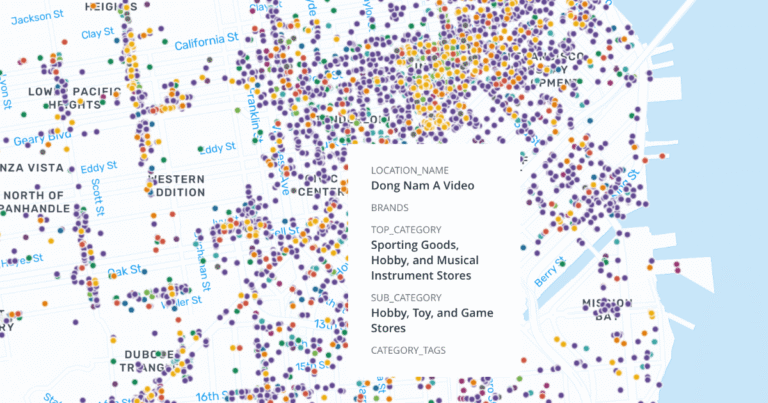
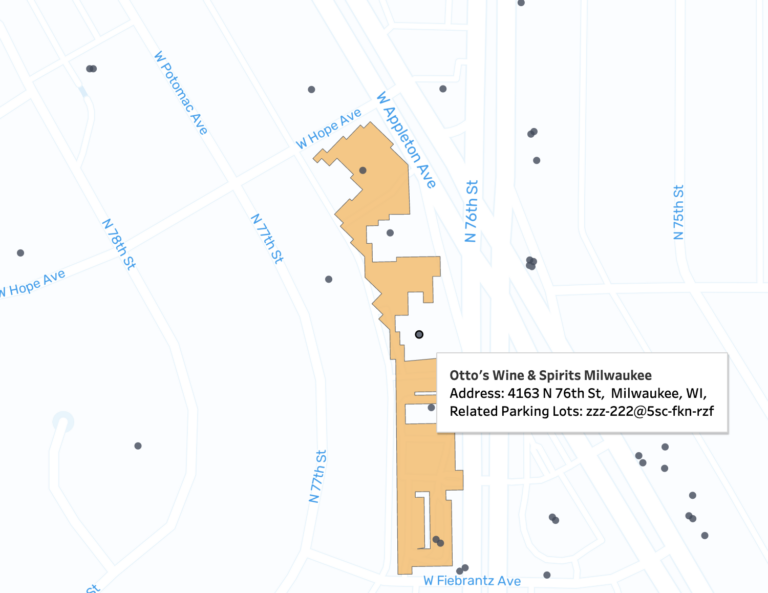
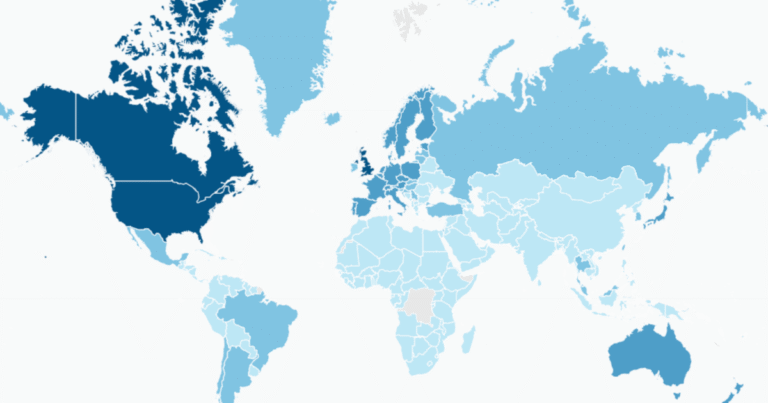
Premium global point of interest data
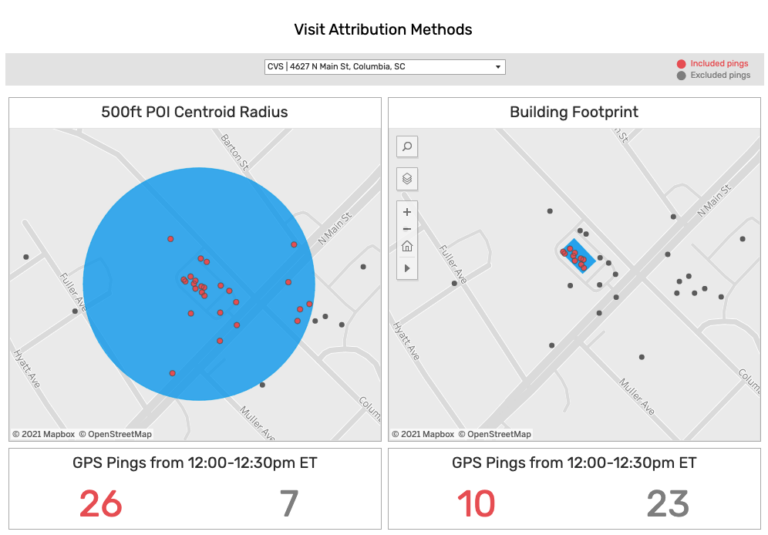
Reduce attribution errors with high-quality building footprint data
Structured global address data for validation, routing, and analytics
Delivery to your preferred environment
Datasets and terms that fit your needs
A Technical Guide to SafeGraph Places Data
Google Places API Alternatives for Sourcing POI Data
The latest SafeGraph and data industry insights
How industry leaders are using SafeGraph data
Lorem Ipsum has been the industry's standard dummy
See what you can build with Places data
In depth articles about geospatial data and how to use it
Top 10 Uses of Geospatial Data + Where to Get It
Clear Channel Europe Uses SafeGraph Data to Fuel More..
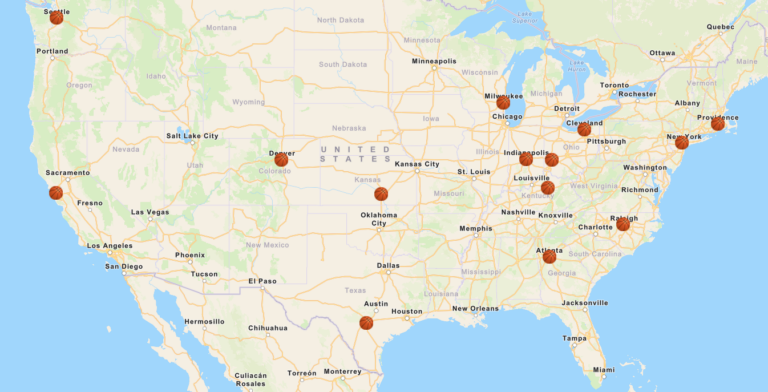
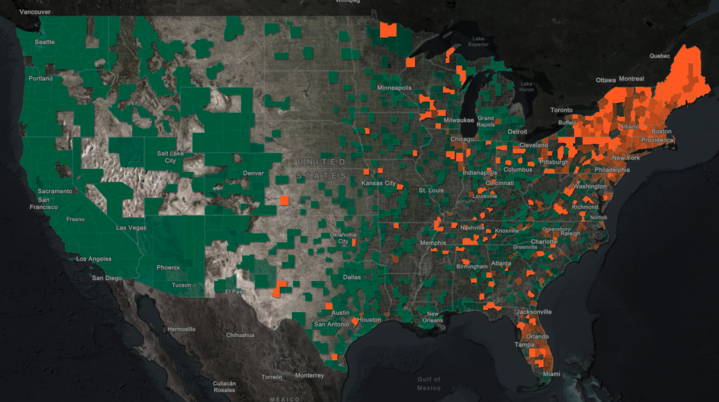
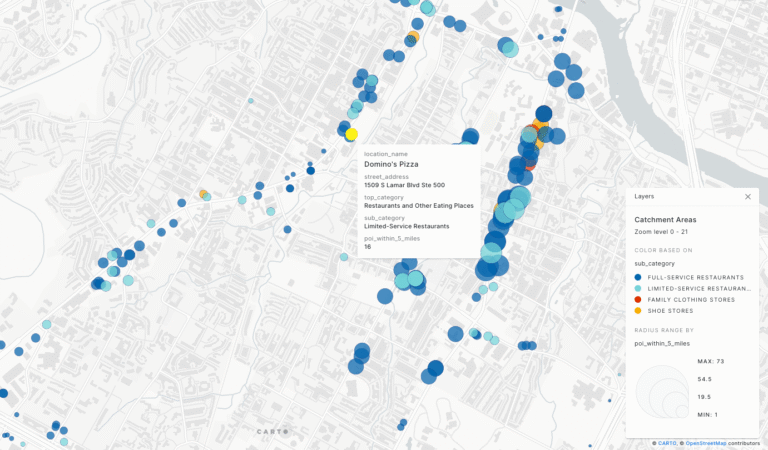
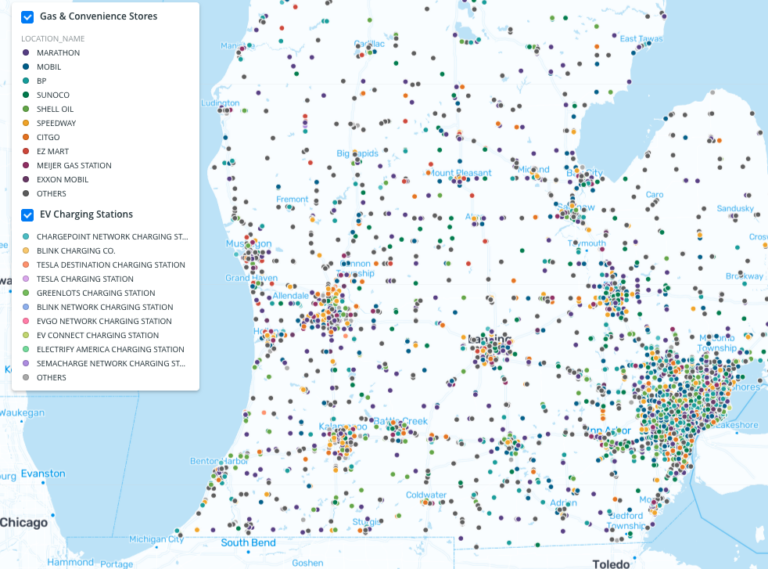
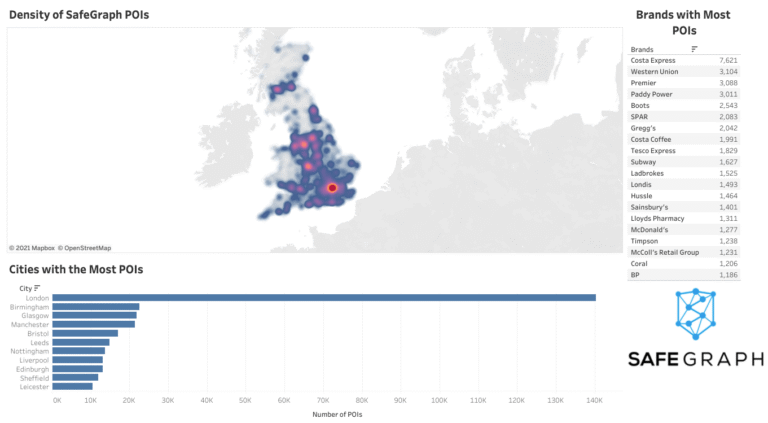
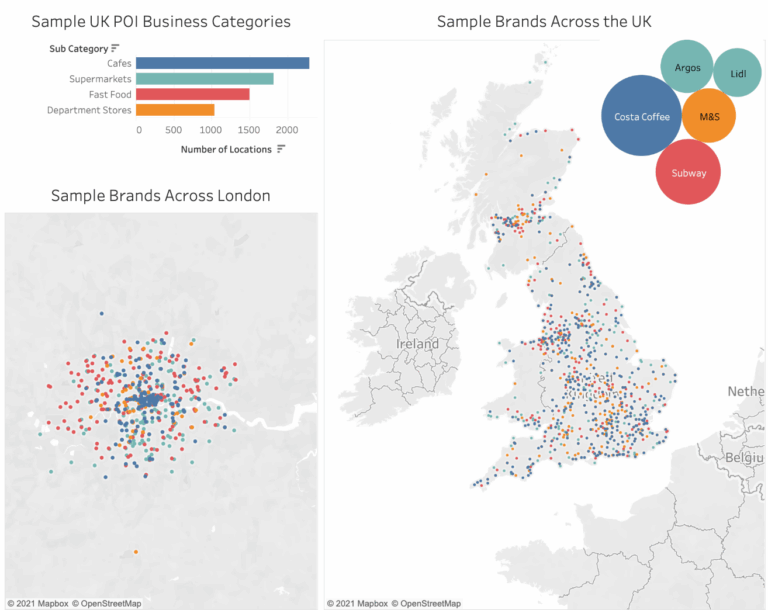
Data Examples
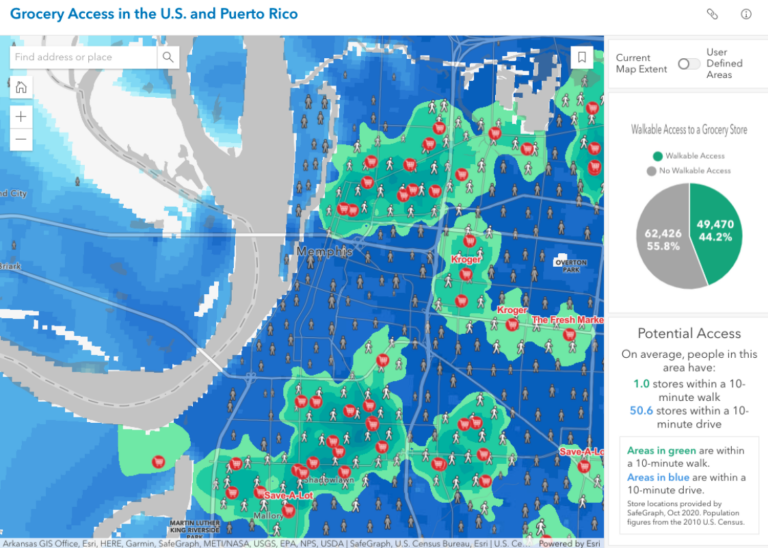
Explore interactive maps and dashboards built with SafeGraph Places to see how location data translates into measurable insights.
Exit Popup