The first thing to know about geospatial data is that it comes in many different forms. Some datasets are more suited to certain tasks than others, and some tasks require more than one type of dataset to see the full picture.
This is why it’s important to be aware of the existence and primary uses of each geospatial data type within your geospatial data ecosystem. So let’s get started by explaining a bit about some of the most common classes of geospatial data you’ll encounter
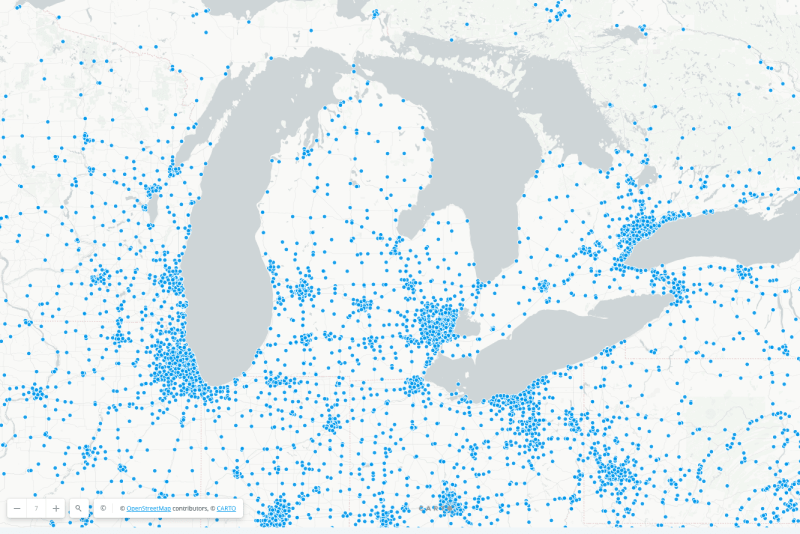
- Points of Interest
- Property
- Mobility
- Demographics
- Address
- Boundaries
- Environment
- Streets
- Imagery
As you can see, there are quite a few to cover. So let’s get to it.
9 geospatial data types: ways of representing places, people, and things on Earth
At SafeGraph, we’ve boiled down the geospatial data ecosystem into 9 distinct data types. Your organization will likely need to use several of them in combination to get the insights that you want, though you may not necessarily have to use them all. It depends on what your operation does and what the specific projects you undertake entail.
1. Points of Interest
Points of interest (or POIs) are one of the most fundamental types of geospatial data. They describe any number and type of physical places on Earth (besides private residences) that people may want to visit, or use as reference in analysis. On smaller-scale maps, POI data can also abstractly represent cities or towns.
Many POI datasets may also contain additional attributes of the points they describe. For example, POI data for businesses may contain information like street addresses, mailing codes, and phone numbers, as well as open hours and brand affiliation.
It is important to note that POI data can be dynamic, especially in regard to human-made points of interest. Sticking with the business example, stores open and close all the time as their owners make strategic decisions. Stale POI data won’t be very helpful if a particular business you’re looking for isn’t at its specified location anymore, or has been replaced by a different business altogether. That’s why SafeGraph updates our Places data every month, to account for this volatility.
Primary uses:
POI data is used in many different ways. Many organizations use it in their mapping projects to show people where things are on Earth, along with other information people might want or need to know about those locations (like store hours). Real estate companies use it to analyze business opportunities and then decide on whether or not an area is worth investing in, based on predictions about population growth and competition.
Retailers and CPG brands use it to assess local market conditions and measure how large their clientele base might be in a certain area. Financial institutions use it to track the openings and closings of different types of businesses across trade areas in order to decide which brands or sectors to invest in. And healthcare planners and providers use it to locate existing facilities, then compare their number and type to surrounding demographics to make sure everyone has access to the care they need. Check out a free sample to get started on your own.
2. Property
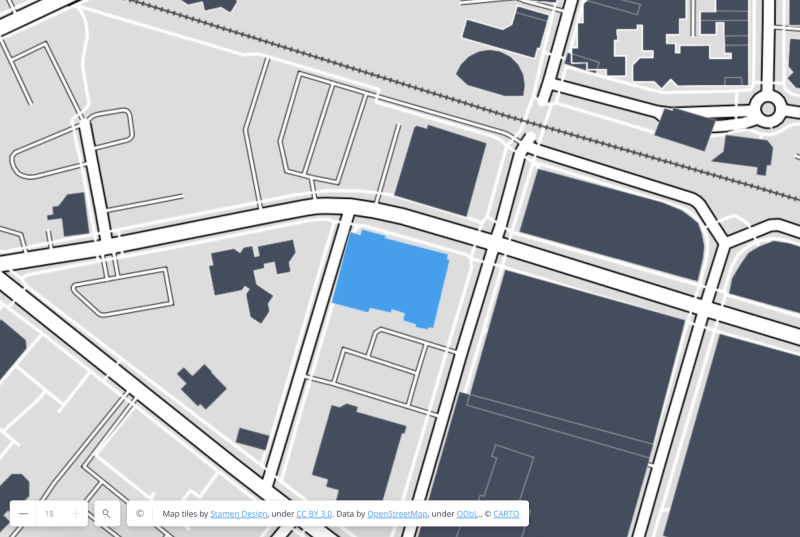
Property data represents the accurate physical boundaries of tangible places in the real world. Usually, it refers to the shapes of buildings or parcels of land. However, it can also be used to refer to different parts of a spatial hierarchy (i.e. multiple properties within buildings), like apartment units, stores in a mall, or offices in a business complex.
Property data is often polygon data. SafeGraph’s Geometry data set is a great example of this type of data, and includes spatial hierarchy metadata to provide detailed context about property relationships.
Primary uses:
Property data is often used in mapping as a more accurate method than point data of representing what a place looks like in the physical world. This is useful for visit attribution, or determining whether or not people actually visit a POI (as opposed to just walking past it) and how long they stay there.
Insurers use property data to more accurately assess a building’s risk factor based on how many people visit it, what other businesses are inside it, and what other buildings are nearby. For example, a nail salon sharing a wall with a fireworks store will have a higher risk profile than a nail salon located next to a daycare center. So insurers can use property data to accurately assess risk and write policies. Check out our free sample to get started on your own.
3. Mobility
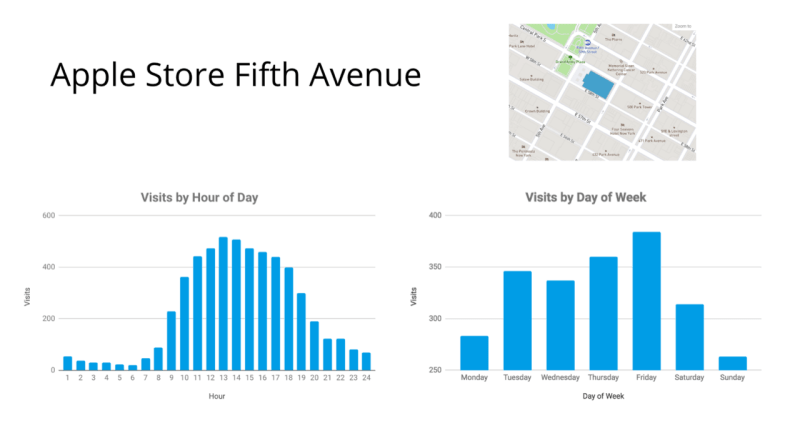
Mobility data refers to aggregated and anonymized data regarding where and when people move about in their daily lives. It is usually collected via global positioning system signals sent out by people’s phones. Mobility data does not provide individual mobile phone locations or activity, but instead provides aggregations of movement at the POI and Census Block Group (CBG) levels to give a general sense of volume and frequency of visits to certain locations.
Primary uses:
Mobility data has several uses. By knowing where people go and what stores they shop at, businesses can make decisions about things like where to locate their own stores, what brands to carry, and where to place advertisements.
Insurers can also use this data to develop general liability policies for properties by looking at approximate visit counts. They can also look at visit counts for different times of the year, for businesses that operate seasonally. As an example, businesses that get more foot traffic in the winter are more likely to have people slip, trip, or fall because of icy conditions. So they have a different risk profile than businesses that get most of their customers in the summer.
Urban planners use mobility data to better understand the communities they serve and how to better support the population. Measuring the volume of people going from one area of a city or county to another at a specific time of day can indicate a need for more public transportation routes, or more housing options near the destination.
4. Demographics
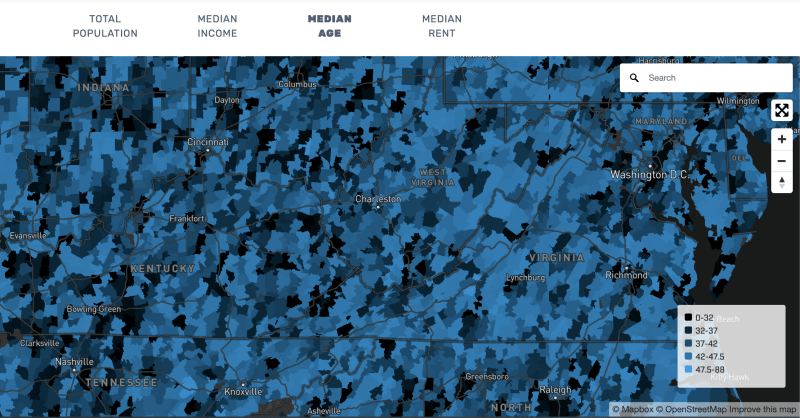
Demographics data refers to aggregated population counts, along with information about characteristics of the people within them. These include things like gender, age, income, housing costs, and so on. They are usually collected through government-run censuses and surveys.
While SafeGraph doesn’t typically produce these kinds of geospatial data models, we do clean the data up for use with our POI and mobility data so that groups looking to analyze it can more easily find what they’re looking for.
Primary uses:
Demographic data is often combined with mobility data to get a sense of a business’s potential clientele – not only who visits the area, but also who actually lives there. By looking at the mobility, lifestyles, and economic strength of people who live in (and move through) an area, businesses can get an idea of whether that area is worth investing in or not. And if they do decide to invest, businesses can also use demographic data to help determine where to locate their stores, how and where to position their advertising, and what products and brands to carry. Check out our free sample to get started on your own.
5. Address
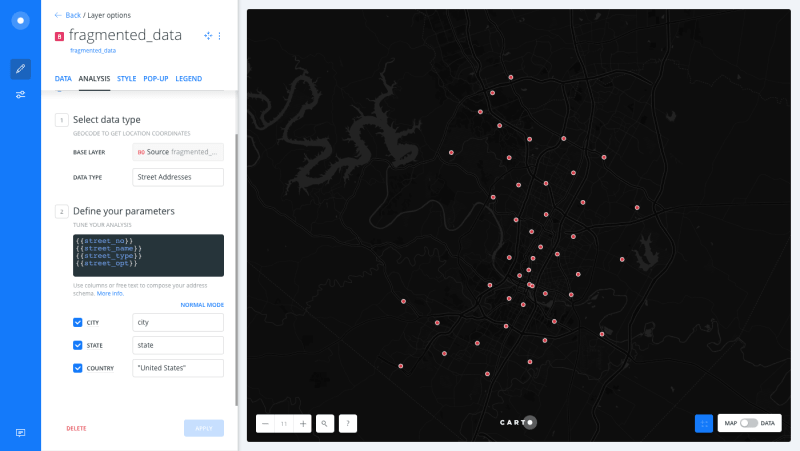
Address data is the foundation for any geospatial data. It provides navigation-related information regarding specific places, represented by pairs or sets of geographic coordinates associated with street addresses.
Primary uses:
Address data is used to map, visualize, and analyze where places are located. Address data is an important input in POI data, but differs in that it can represent residential places (as opposed to just places where businesses operate or people spend time and money). While address data can be extremely helpful as an analytical input on its own, it can also be used in conjunction with other geospatial data types to see what is exactly happening at a specific place. For example, joining address data to weather data can reveal historical weather patterns at a granular level, and joining it to boundary data shows which school district or tax jurisdiction a place falls within.
Address data is also fundamental to geocoding: translating street addresses into geographic coordinates and vice-versa (reverse geocoding). It may also be used to check whether an address is actually tied to a real place (address validation). Street data is usually built with address segments, requiring accurate geocoding to get a true rendering of where a place is located on that street.
Address data is one of the trickiest geospatial data formats to work with because it’s difficult to standardize. Street addresses, in particular, contain multiple pieces of information that can each be commonly represented by different acronyms, abbreviations, and punctuational variations (e.g. “USA” vs. “U.S.A.” vs. “America”). This can make it very easy for a computer to mistake two addresses that point to the same location as representing entirely separate places. Unique identifiers (or join keys) for addresses, like Placekey, can help mitigate this problem. We’ll talk more about this in the chapter on the challenges of working with geospatial data. Check out our free sample to get started on your own.
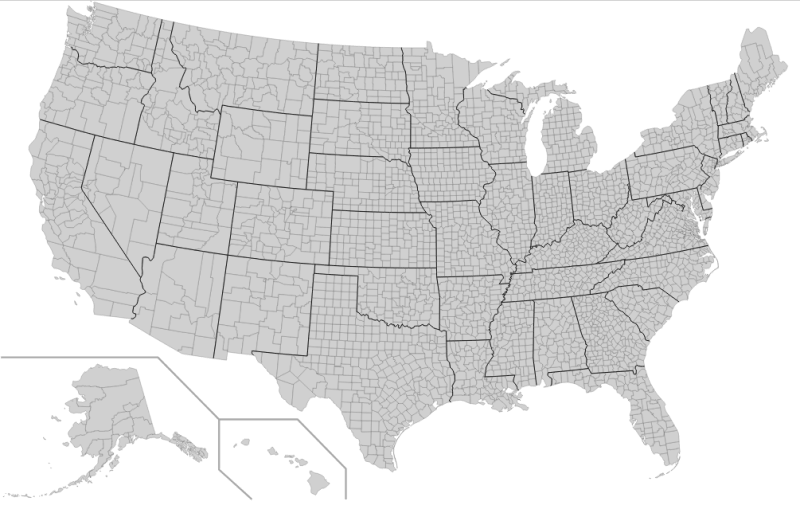
6. Boundaries
Boundary data is like a large-scale version of property data. It outlines the limits of larger geographic areas that typically contain more than one address, property, and/or point of interest. And, like property data, it is usually represented by polygons as opposed to singular points.
Primary uses:
Boundary data serves an organizational purpose in mapping, often being used to designate separation between countries and the regions within them. On a more local scale, boundaries can be used to analyze the catchment areas of schools and other important facilities. Or a business could use boundary data to make decisions on where to locate their shops or display their advertising, based on the rules or other attributes of the jurisdiction(s) they fall under. Real estate investors or brokers can use boundaries in much the same way.
7. Environment
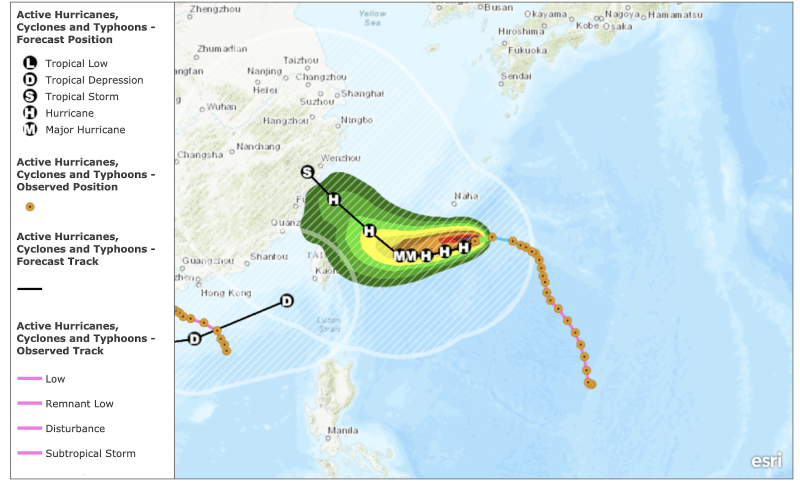
Environmental data relates to natural geographic phenomena. These include things like climate (including weather and temperature patterns), tides, elevation, seismic activity, and flora/fauna habitats or migration patterns.
Primary uses:
Obviously, environmental data is critical to conservation workers and other environmentalists. But it can also be useful to people working in the insurance sector. By analyzing how prone an area is to, say, the effects of extreme weather and natural disasters (such as fires, flooding, wind damage, and structural collapse), insurers can take this information into consideration when performing risk assessments and developing liability frameworks.
8. Streets
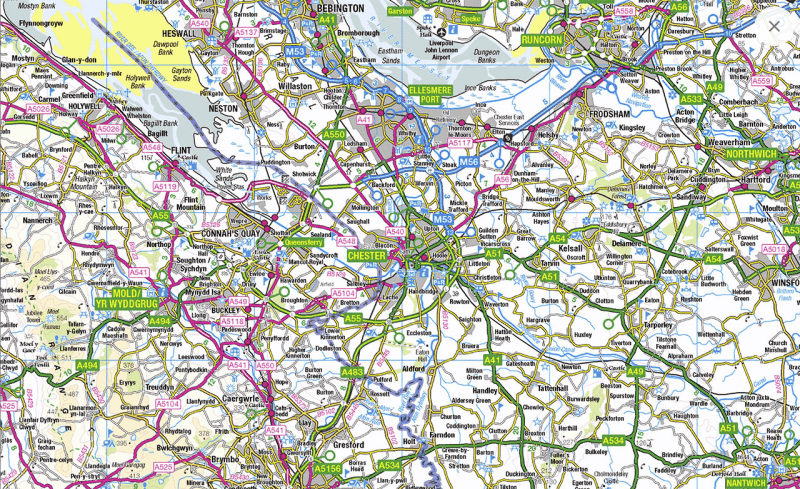
Street data provides information about road transportation networks. It may also include information about the volume of traffic on these routes at certain times, and sometimes the causes (such as construction, inclement weather, or accidents).
Primary uses:
Street data is integral to many forms of mapping, as it provides context on transportation routes for people looking to get from one place to another. Advanced street data can also help with planning a specific (or alternate) route if one or more is overly obstructed or completely blocked off. Routing applications and tools provided by GIS software use street data as an essential input.
9. Imagery
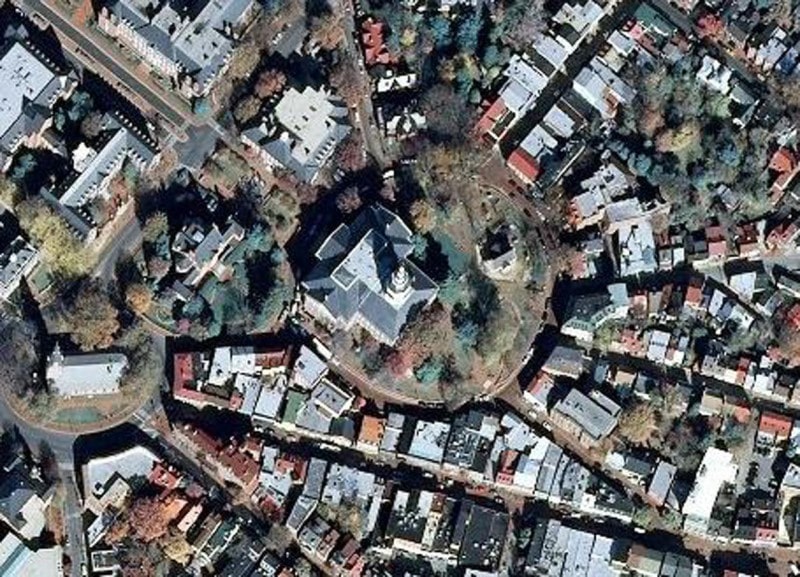
Imagery data refers to true-to-life representations of what places look like in the physical world, whether those places are natural land and water masses or man-made structures (such as buildings and roads). It usually consists of aerial photography or satellite imaging. Imagery data is always in a raster format, which means that it stores information as a grid instead of as points, lines, or polygons.
Primary uses:
Imagery data is typically used in mapping, often as a contextual foundation for other geospatial data layers (i.e. a basemap). Conservationists and other environmentalists can also use it to get a more accurate depiction of what the surface of the Earth looks like at any given point in time. This can reveal information important to them but that may not be present in other maps, such as tree cover, water quality or level, animal herd movements, and spread of wildfires.
A fundamental step in using geospatial data for your organization is learning precisely what’s out there, as well as what kind of information each type can (and can’t) tell you.