Historically, data about visit patterns has enabled hundreds of organizations – from the CDC to Sysco and everything in between – to measure and analyze how many people visit physical places, when they go, and where they come from. But many are still searching for a location-based way to analyze spending behavior.
Introducing: SafeGraph Spend
To empower our customers with places-based spending data, we developed a brand new product offering: SafeGraph Spend.
Spend data makes it easier than ever to understand customer behavior and perform competitive analyses. While other data providers offer transaction data, no one else delivers it at the same precise, POI level as SafeGraph Spend.
Spend data is updated monthly, making it much more fresh and accurate than quarterly earnings reports. Many organizations rely on company reporting for indicators of a brand’s sales performance, which is often published quarterly. SafeGraph Spend provides aggregated and anonymized transactions for specific brand locations at a monthly cadence, so performance can be analyzed more frequently and more accurately. The rich metadata included with Spend also makes it possible to understand spending patterns by day, geography, and medium (online vs offline).
Validating Spend Data for Brands Against Company Reporting
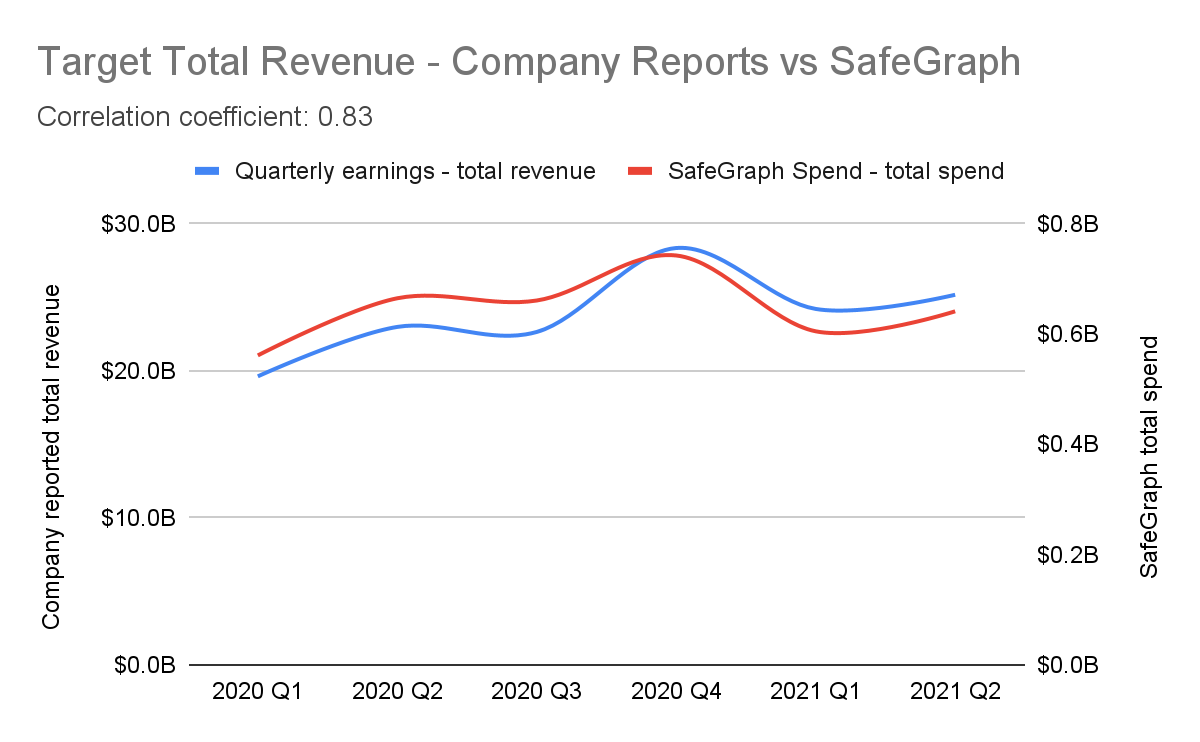
To test the efficacy of Spend data, we decided to compare it to company reporting, which many organizations currently use to analyze a brand’s sales performance. First, we aggregated raw_total_spend by brand and compared it against publicly reported quarterly earnings figures.
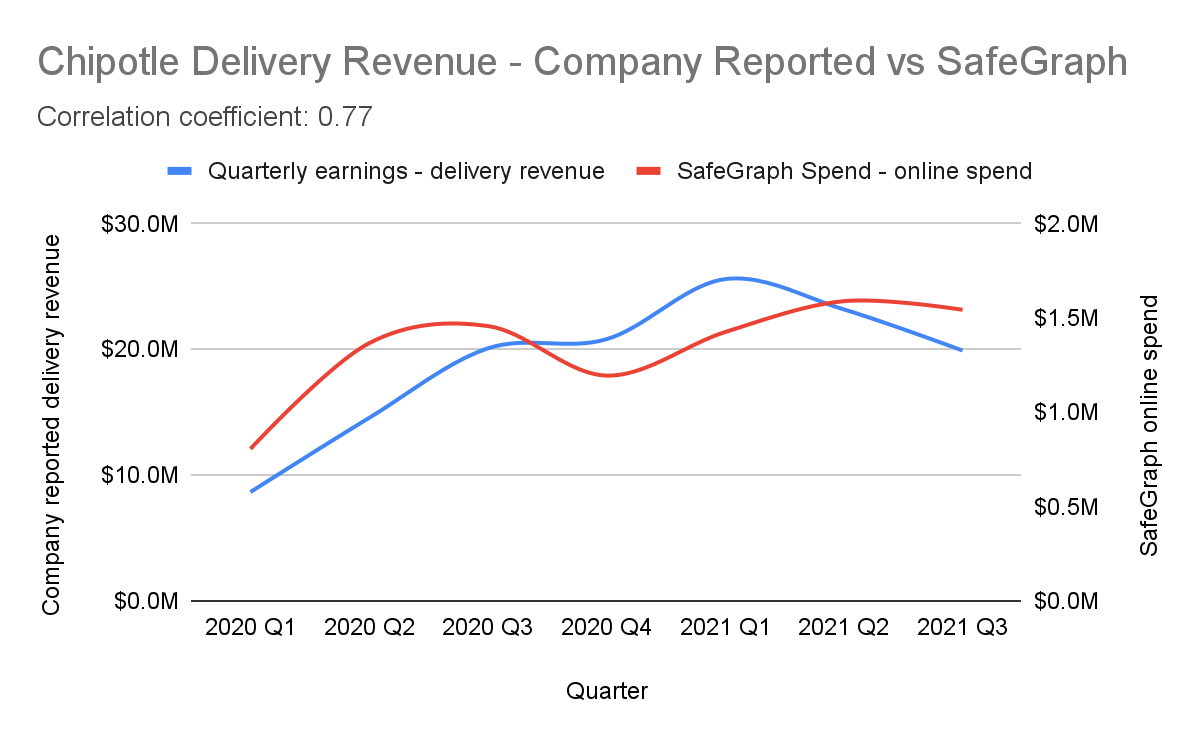
Some brands, such as Chipotle, differentiate between in-store vs online or delivery transactions in their quarterly reporting. SafeGraph Spend also differentiates between purchase types. In addition to raw_total_spend, Spend has additional columns such as online_spend and spend_by_transaction_intermediary which indicate the platform used in the transaction. For example, here we can see Chipotle transactions via delivery services using the online_spend column.
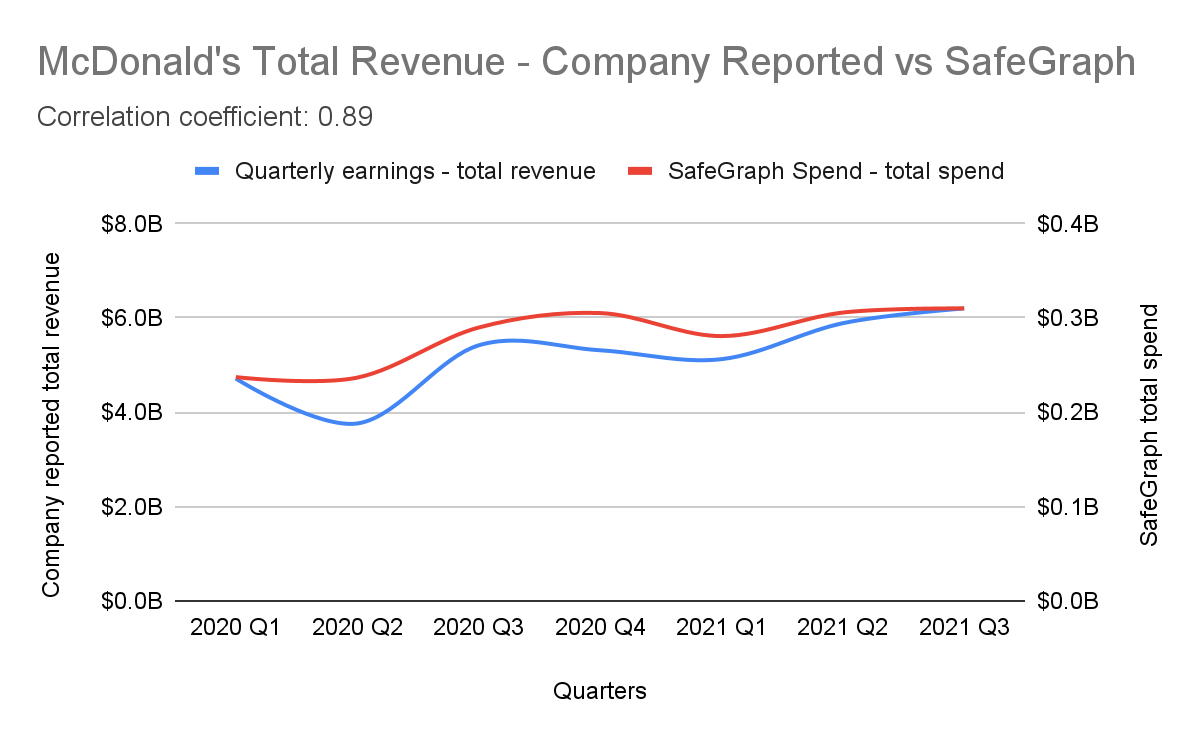
The Spend dataset facilitates analyzing seasonal or event-based changes in spend by location. When looking at McDonald’s, we can see changes in spending behavior due to COVID-19 in Q2 2020. If we drill down to the state or individual store level, we can observe the COVID recovery rate more closely.
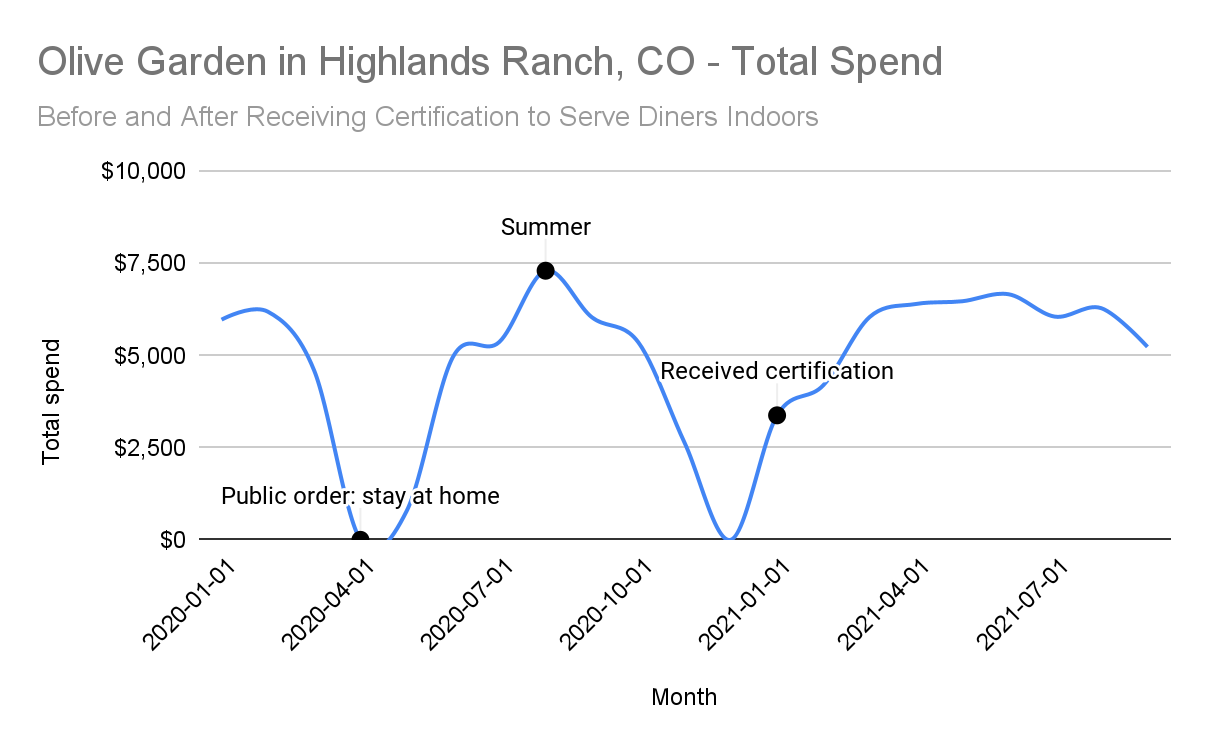
For example, in early 2021, Colorado restaurants were required to have a certification to serve diners indoors. We can observe that change in SafeGraph Spend data for that timeframe. A similar methodology can be used to analyze the effect of new promotions, loyalty programs, or the addition of a restaurant to new delivery platforms.
Watch our on-demand webinar to learn more on how this places-based transaction dataset enables you to uncover insights on spending changes over time at specific POIs, while comparing spending trends between locations and across regions.