How much work is your company’s financial data really doing? Sure, it forms the basis of your organization’s investment-related decision-making. However, it’s only as good as your ability to organize it, interpret it, draw the right conclusions from it, and take appropriate action. And let’s face it: not everyone on your team has the data science skills to do all those things by themselves.
Enter financial data visualizations. Putting financial data in these more picture-based formats makes it easier to digest for non-technical team members than it would be in a bunch of tables and spreadsheets. So the right data gets understood by the right people, who can take the right actions on it at the right time. Learn about the power of visualizing financial data in these sections:
- What are financial data visualizations?
- 9 reasons why financial data visualizations are useful
- How to get data for financial visualizations
- 6 financial data visualization examples to get you started
- Top 8 financial data visualization tools
We’ll start by reiterating in a bit more detail what we mean by visualizing financial data, and then get into why and how to do it.
What are financial data visualizations?
Financial data visualizations are methods of visually (usually pictorially) representing financial data such as profit & loss, sales figures, income & expenses, assets & liabilities, and equity. Some common examples include charts, graphs, maps, infographics, diagrams, and virtual dashboards.
The overall point of visualizing financial data is to make it more accessible to key stakeholders so they can take appropriate action on it. We’ll explain some specific examples in the next section.
9 reasons why financial data visualizations are useful
When you visualize financial data, you’re helping people at your organization see beyond just numbers and spreadsheets. You’re exploring a key question (or maybe multiple ones), or telling a story people can easily draw conclusions from. Here are some reasons why that’s so powerful:
- Most people are visual learners – Sight is the dominant information-processing sense in most human beings, so representing data visually makes it easier to understand and remember.
- Compartmentalize relevant data – Stakeholders don’t want to go through the massive quantities of data companies handle these days, so visualizations allow for chunking down data into relevant pieces that are easier to process.
- See trends easier – Data visualizations, especially interactive ones, make it much easier to spot patterns that can be taken advantage of – or anomalies that require corrective action.
- Give geospatial context – Mapping financial data to physical locations allows stakeholders to see beyond what happens to where (and sometimes when) it happens, helping them understand why it happens.
- Get the bigger picture – Visualizing data from multiple datasets at the same time, especially when it’s a mix of financial and non-financial data, can reveal insights a single dataset on its own might not be able to tell you.
- Make decisions faster – Because data visualization allows stakeholders to more quickly connect the dots between discrete pieces of data, they can spend more time taking action on insights and less time interpreting to get those insights in the first place.
- Reduce the risk of errors – Since data visualization makes it easier to use patterns and trends as guides, it’s less prone to errors compared to doing calculations and analysis manually.
- Predict and set goals more accurately – Another benefit of seeing data in context with visualizations is it becomes easier to make more accurate predictions, as well as set more reasonable and precise financial targets.
- Improve your marketing – Customers often understand less about a company’s data than the people inside the company do, so visualizing that data makes it easier for them to retain information and quickly make comparisons.
How to get data for financial visualizations
Usually, financial data will come from within your own company. Other companies may release their financial data, but generally only as a form of marketing or because they are mandated by law to do so (e.g. quarterly earnings reports). You can find some of this information from government sources, but other times you may be able to find it on a company’s website, social media feeds, or advertisements.
The problem is this data often isn’t in structures or formats that make it easy to visualize or otherwise draw inferences from. That means it can take extra time, effort, and resources to wrangle this data before it’s usable. Fortunately, SafeGraph is a company that specializes in cleaning data ahead of time to make it easier for you to get right to the analysis part.
Our Spend dataset is a first-of-its-kind database on debit and credit card transactions that includes attribution related to both time and location. That means you can use it to compare spending trends at points of interest across a geographic area, or measure the sales performance of specific brands at multiple locations. You can even track a specific store to see how the number and magnitude of transactions changes over time.
6 financial data visualization examples to get you started
We should offer the caveat here that gaining the benefits of visualizing financial data requires choosing an appropriate way to present it. Otherwise, you risk your audience not understanding the insights you’re trying to convey. Or worse, the audience might draw the wrong conclusions because the data has been misrepresented somehow.
To show you what we mean, here are a handful of financial data visualization examples SafeGraph has created or contributed to, in order to show you how to visualize financial data effectively.
1. QSR Consumer Spending Trends
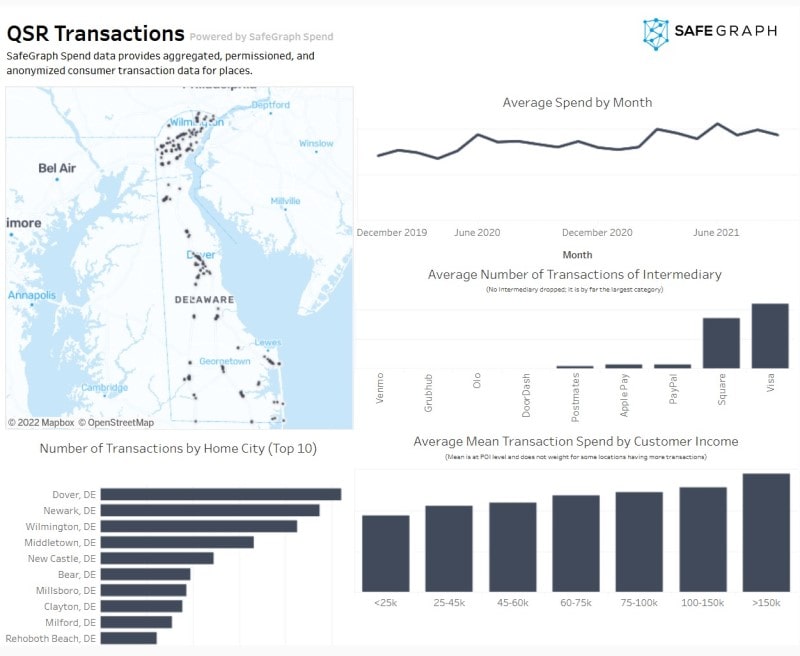
A dashboard powered by Tableau and SafeGraph data that illustrates consumer spending habits at quick-serve restaurants throughout the state of Delaware from January of 2020 to September of 2021. It includes measures of transactions by home city, average spending over time periods, transactions by intermediary, and average transaction total by customer income bracket.
There are many insights that could be derived from these visualizations. Companies can see where customers are visiting their stores from and what demographics they belong to. They can also see when the prime months for business are so they can ramp up their operations accordingly. Third-party payment managers (particularly Square and Visa, in this case) can also use them as barometers to see which QSR chains to approach for (wider) adoption.
2. Understanding Changes in Consumer Behavior During a Natural Disaster: Hurricane Ida
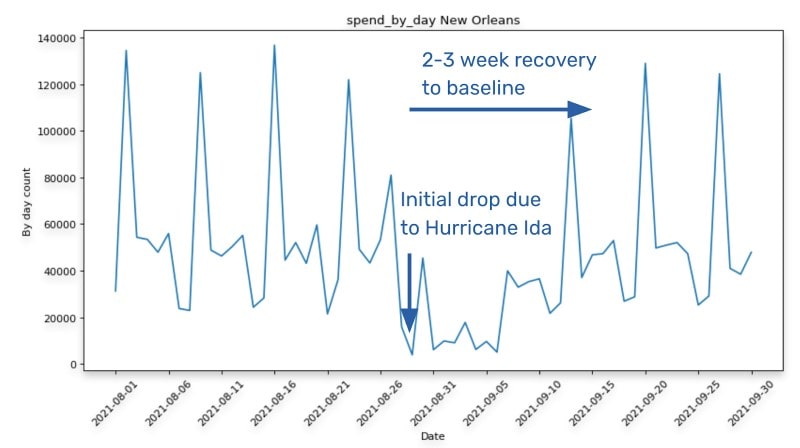
An examination of human mobility and consumer spending in New Orleans (and other parts of Louisiana) before, during, and after Hurricane Ida in August of 2021. From the visualizations, we inferred two major patterns. First, coastal areas of New Orleans (and southeastern Louisiana in general) saw larger drops in movement during and after the hurricane, as people tended to remain sheltered for longer in more vulnerable areas. Second – as pointed to by the example above – mobility and spending saw sharp declines when the natural disaster hit, then took about 2 to 3 weeks to recover to pre-disaster levels.
Visualizing these kinds of data can help with disaster readiness, response, and recovery. Companies and governments can plan when (and where) to concentrate their resources in order to accommodate pre-disaster stockpiling, aid people most isolated by the disaster, and speed up a return to normal social and economic activity for the affected areas.
3. How to Enrich POS Data to Analyze & Predict CPG Sales
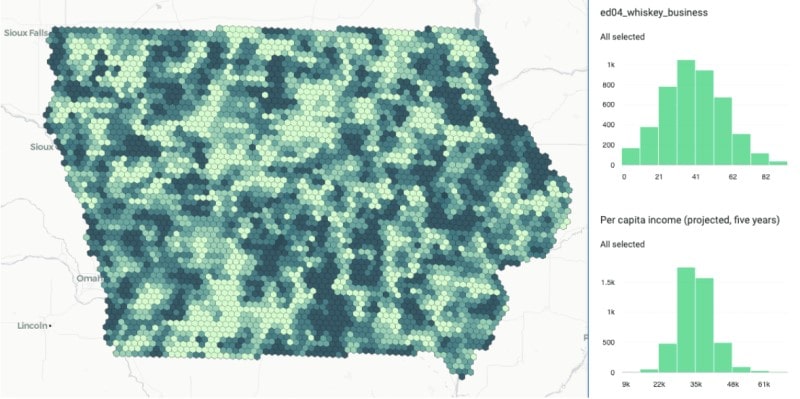
A project CARTO did with data from Mastercard, Spatial.ai, Applied Geographic Solutions, the US Census Bureau, and our Patterns dataset. It sought to model the sale of liquor products across Iowa through 2018-2019 in relation to local geospatial factors such as nearby points of interest, per-capita income of demographics, and social sentiment regarding interest in liquor. The goal was to create a model that could be used to predict sales in areas with similar geospatial conditions, without needing historical sales data for those areas.
4. Analyzing Foot Traffic Data in Private Equity
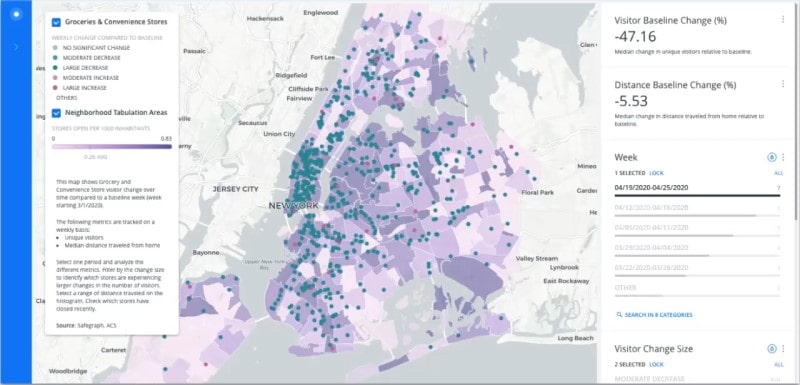
A webinar we hosted with CARTO and American Securities in December of 2020 discussing how foot traffic (and other types of alternative data) can be used to inform investments in private companies. An example is the dashboard pictured above, which visualizes grocery and convenience store visits in New York in March and April of 2020 after the onset of the COVID-19 pandemic. The overall trends show people were visiting these types of stores less frequently, and were not traveling as far from home to do so.
However, certain stores actually saw large increases in visits. And while unique visits to grocery and convenience stores decreased, dwell times and spending at these locations actually increased. These patterns could point to people trying to cut travel times and overall trips in order to reduce their potential exposure to the COVID-19 virus. Or they may have been trying to stock up because they anticipated stores closing or not having certain items available.
In any case, these are the sorts of behavioral insights geographically visualizing financial data can provide private equity investors. It can help them determine which types of stores will be in demand based on what kinds of products they carry, how many people live nearby, and how accessible the store locations are. It can also help investors guess things like whether new stores opening in an area will be successful based on the level of competition they have.
5. Improving Economic Forecasting with Alternative Data
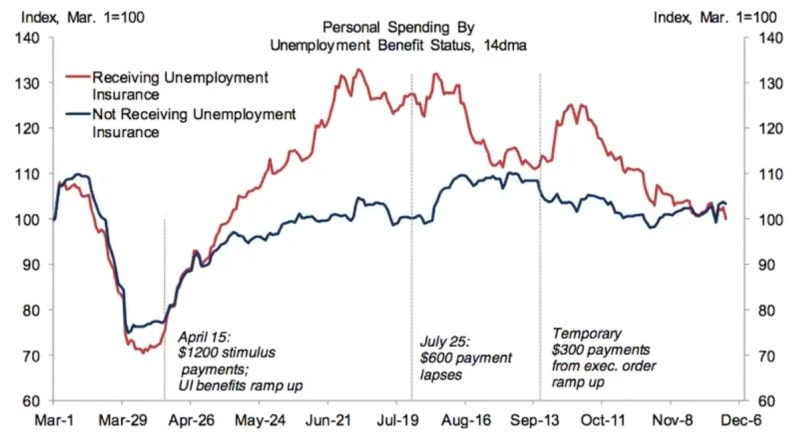
Another webinar we hosted, this time with representatives from Goldman Sachs. It explains why and how to use alternative data to supplement official financial data in predicting economic trends, especially over volatile time periods such as during the COVID-19 pandemic.
The visualization shown above displays the average rate of personal consumer spending in the United States, based on whether consumers were receiving unemployment benefits or not, over a stretch of the COVID-19 pandemic (March-December 2020). It also notes dates on which there were significant changes to US unemployment benefits.
As can be seen, spending among both groups hit a trough in late March and early April as unemployment, store closures, and public health restrictions limited economic activity. Past that, however, the consumer group receiving unemployment insurance had much more dramatic spikes in spending patterns relative to when benefits and government stimulus payments increased or reduced. Both groups returned to about the median rate of spending by the end of the year.
Visualizations like these can provide a more on-the-ground snapshot of economic activity in a geographic area. They can display trends in things like spending patterns, bankruptcy filings, foot traffic in rural vs. urban areas, consumer sentiment regarding particular issues, and even economic activity in locations sensitive to major market shifts. This can let a company forecast the state of an industry or economy before the official data is released. Then the company can use the official data to gauge the accuracy of its predictions.
6. Validating Spend Data for Brands Against Company Reporting
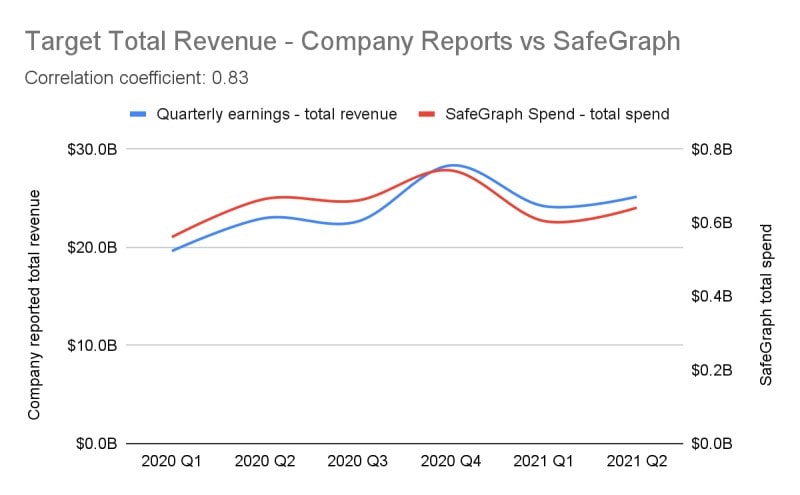
A demonstration of how our new Spend dataset can be used to compare measured financial data against figures a company officially reports. The example above compares Target’s reported quarterly earnings in 2020-2021 with the total amount of money spent in their stores over the same time period. Visualizing financial data in this way can allow companies to observe how spending trends change in response to certain events, or to compare profit & loss metrics against actual sales performance. Spend even allows this to be done within specific geographic areas, right down to individual stores.
Top 8 financial data visualization tools
Another part of doing financial data visualization correctly is using the right tools for it. The best ones let you consolidate your datasets, build visualizations through dragging and dropping assets, search and get help through intuitive functions, and/or teach virtually anyone on your team how to create visualizations through a user-friendly interface. Here are some of the top platforms to construct your financial data visualization on.
1. Tableau
Tableau is currently one of the most popular general platforms for visualizing data. Its very intuitive interface allows for running queries by simply dragging and dropping data sources, and is designed with clean visuals that are easy to understand because they aren’t overly technical. Tableau’s role-based licensing allows team members to work within their skill sets, and its vast user community is always coming up with new ways to make the experience more powerful and user-friendly.
2. Microsoft Power BI
A data visualization platform from Microsoft, Power BI can take both structured and unstructured financial data and turn it into understandable business models with the help of advanced AI technology. It also allows for monitoring and visualizing analytics in real time. Power BI can be integrated with Excel – another popular financial data analytics tool – as well as many other Microsoft programs and systems.
3. Esri ArcGIS
ArcGIS is one of the most powerful platforms for analyzing spatial data, but it can also be used to analyze financial data and other forms of data. It’s primarily a mapping product, so it’s perfect for creating data visualizations, especially ones that illustrate data’s relationship to locations. ArcGIS also has a whole host of extensions for use cases in finance, business, military, energy, environmentalism, and beyond. Learn more about SafeGraph’s integration with ArcGIS.
4. CARTO Builder
CARTO Builder is another spatial data analysis platform that can also be used to visualize financial data and other types of data. It integrates with many other popular cloud data and analytics services such as Databricks, Amazon Redshift, Google BigQuery, and Snowflake. It also can draw on an in-house catalog of over 10,000 datasets concerning finance, human mobility, weather, demographics, points of interest, road traffic, and more from over 40 trusted sources. Wherever you source your data from, CARTO’s Builder platform makes it easy to carry out analysis quickly and construct a visualization out of it. Learn more about SafeGraph’s integration with CARTO.
5. Mapbox Studio & Mapbox Tiling Service
Mapbox is all about mapping – where things are, where people are going, and how far the boundaries of places extend. So it’s a fantastic platform if you want to visualize financial data with respect to geography on a map. Mapbox Tiling Service makes it easy to plug in sources of financial data to visualize them in a map that changes as the data does. Or, if you want full control, Mapbox Studio allows you to design custom maps that suit your purposes. You can swap color palettes, change road widths, add terrain contours, make building footprints 3-dimensional, toggle points of interest on or off by category, and much more.
6. Domo
Domo is a notable up-and-coming business intelligence platform that includes some neat data visualization tools. For one, it will suggest an appropriate visualization to use based on the data you upload. It also lets your team collaborate on and annotate visualizations in real time, as well as set alerts for when key metrics hit significant benchmarks. You can also use Domo to build custom interactive dashboards that are optimized to display consistently on any device. Learn more about SafeGraph’s integration with Domo.
7. Amazon QuickSight
Amazon QuickSight is a data visualization platform powered by cutting-edge machine learning technologies. This lets you create a visualization or do advanced financial data analysis by asking simple, natural language questions. As part of the Amazon Web Services suite of cloud-based infrastructures, platforms, and apps, QuickSight also connects with services like S3 and Athena to store and query data securely. Learn more about SafeGraph’s integration with AWS.
8. HEAVY.AI
Formerly known as OmniSci, HEAVY.AI uses state of the art graphics and computing to put you in control of how you visualize your financial data. It allows you to filter common attributes from across internal and external datasets, and even monitor them over time. It also allows for quickly iterating dashboards multiple times so you can make comparisons, estimates, and forecasts without changing your core parameters. It even has mapping capabilities so you can add a location dimension to your analysis – as global or as granular as you’d like.
So now you know what financial data visualizations are and why they’re useful. You know where to get the data for them, what effective ones look like, and which platforms can help you build them with ease. So there’s just one thing left to do: get out there and start making them. But be sure to swing by our site first to look at some samples from our Spend dataset; you might want to get familiar with some kinds of alternative data that could help you.