Some of the most common questions we receive are focused on how we build and source our datasets. SafeGraph creates our products from a combination of machine learning, web crawling, and third-party licensing. In this blog post, we break down the sourcing process for each of our datasets.
1. Places
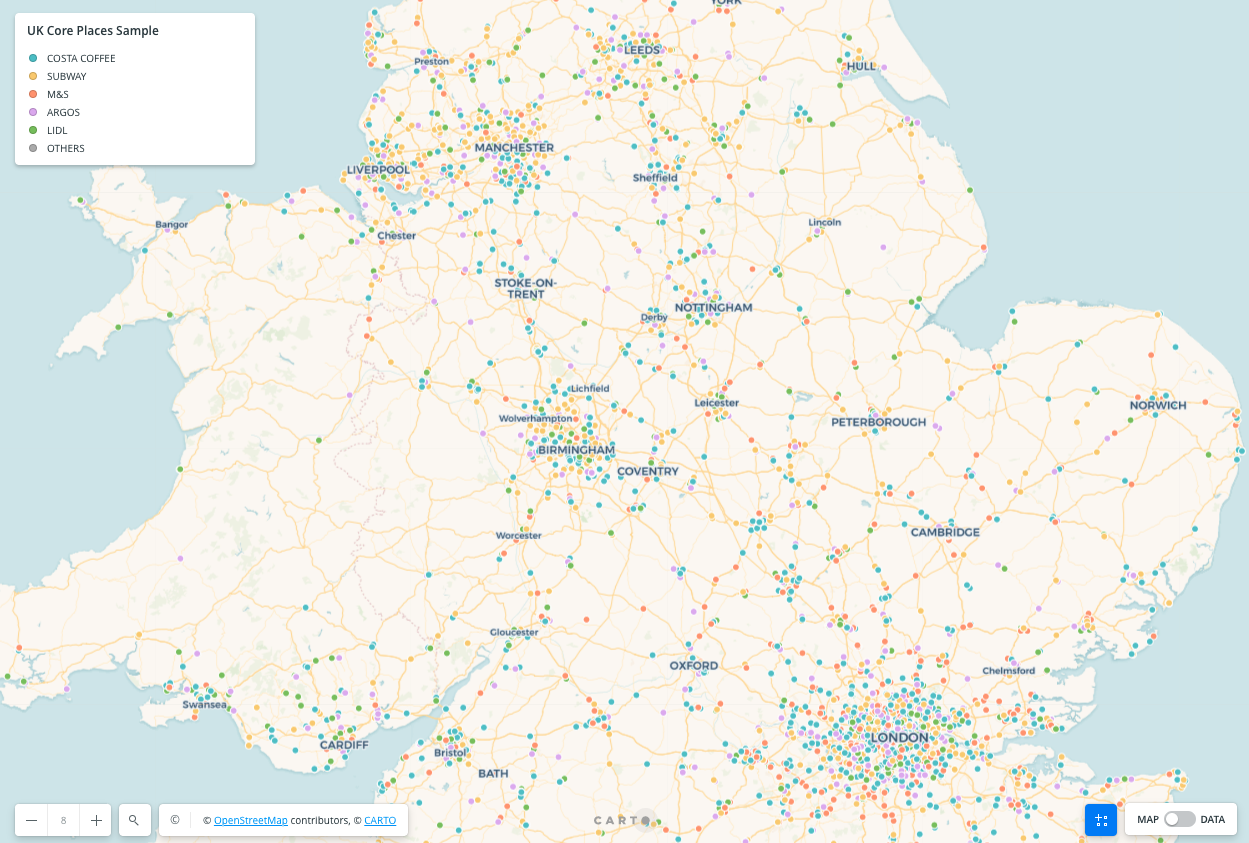
SafeGraph’s Places dataset provides points of interest (POI) data and detailed attribution for non-residential places. Along with the geospatial coordinates and address of the POI, we provide information like brand affiliation, open/close time, and NAICS codes for deeper context and increased analytics possibilities.
SafeGraph sources POI data in a variety of ways:
- Crawling open store locators on the web (ex. crawling a brand’s website that lists where all of its stores are)
- Using publicly available APIs and crawling open web domains that provide updated locations for a specific category of POIs (ex. websites that list where all airports are)
- Processing and modeling to infer additional attributes (ex. inferring what category a POI is)
- Licensing third-party data to fill in the gaps
Once we ingest all of this sourced data, we go through a rigorous de-duping and merging process to make sure the Core Places dataset is clean and ready for use. We also identify spatial hierarchy relationships so end-users can understand how POIs relate to one another.
2. Geometry
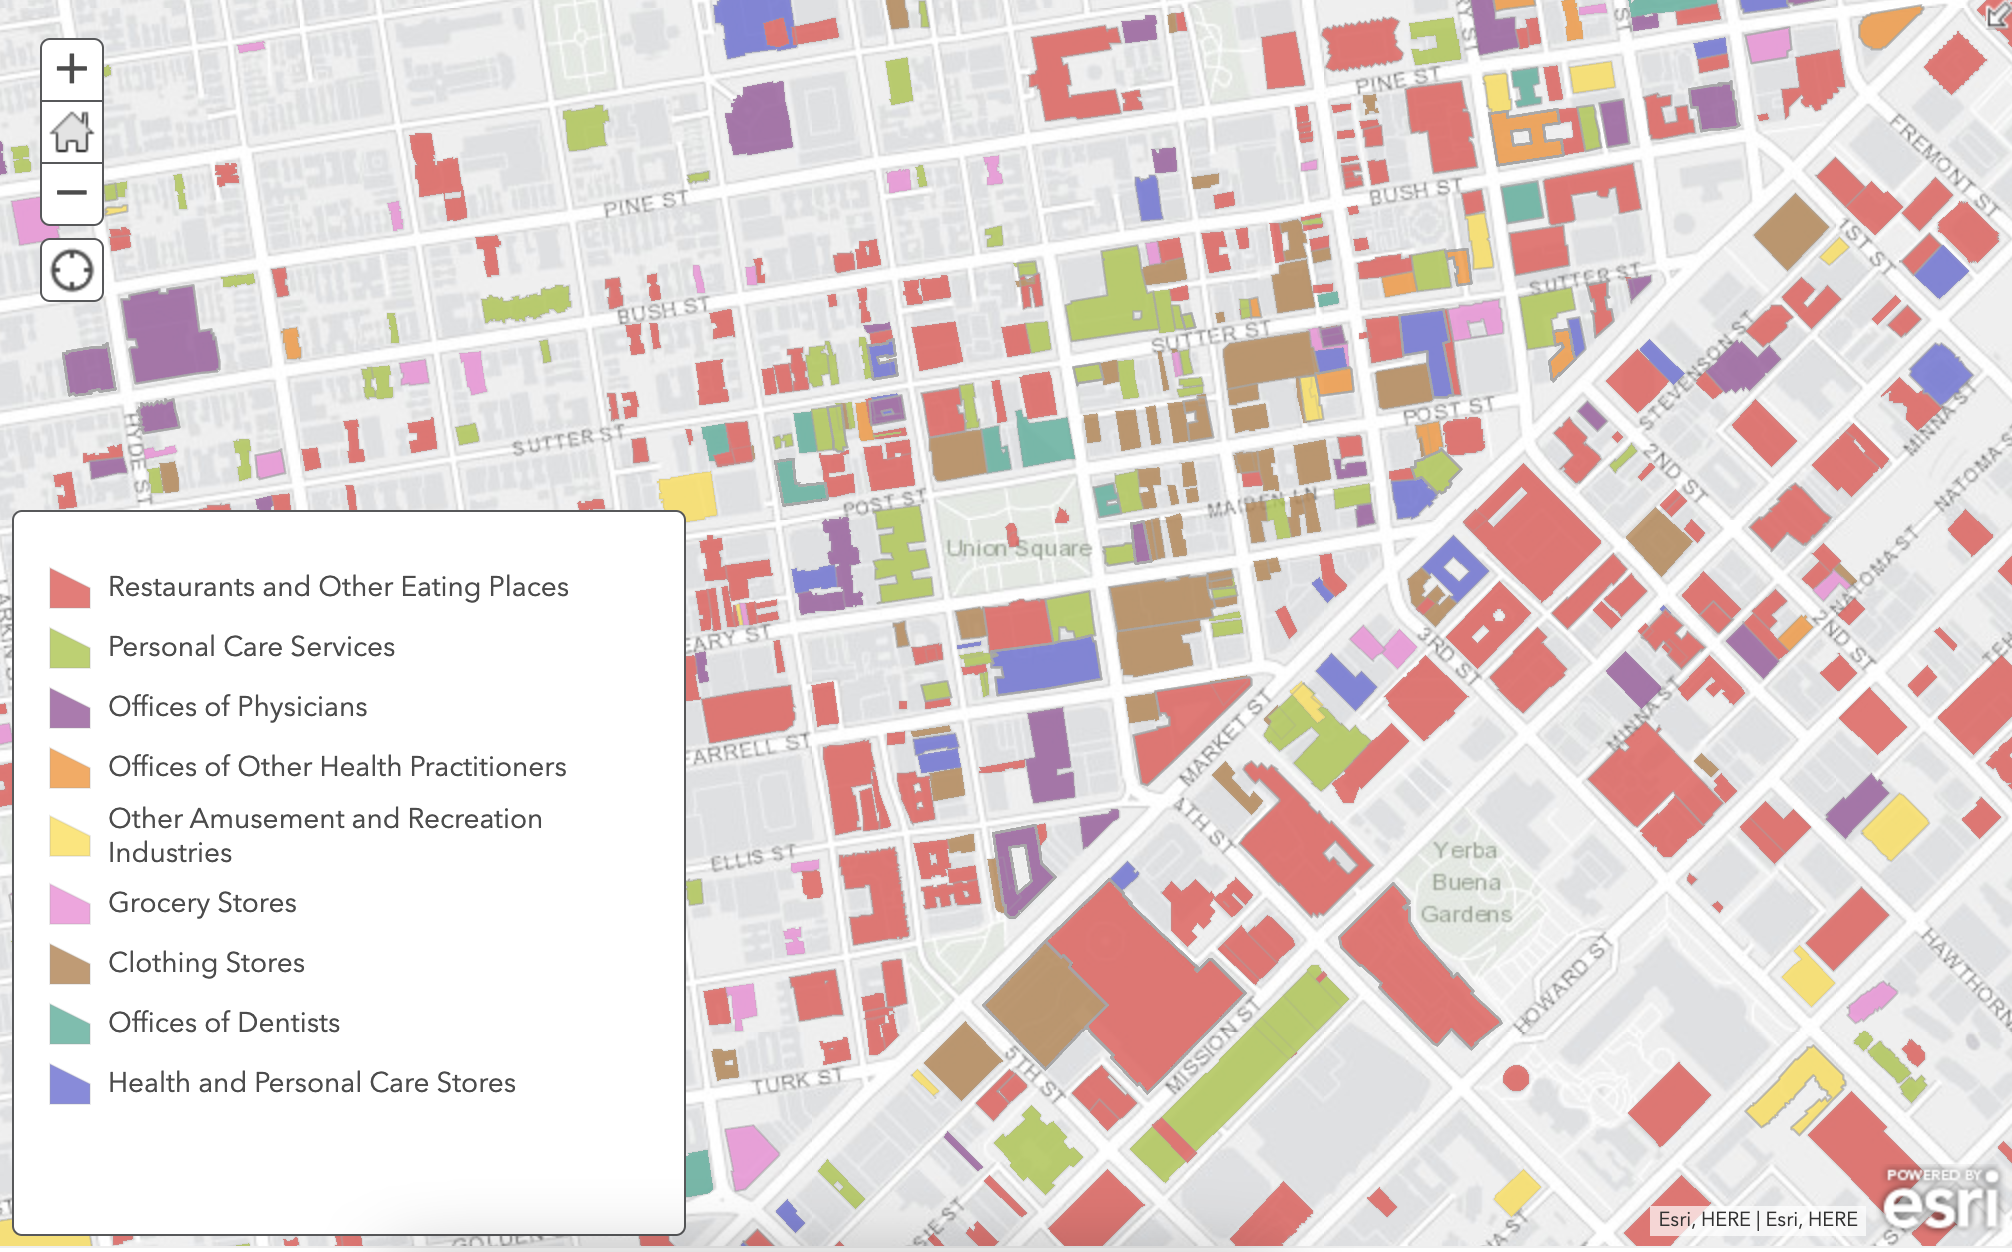
Building upon this POI data, SafeGraph produces our Geometry dataset, which provides building footprint polygons for POIs. As with our Places dataset, we source reliable third-party data and use machine learning to infer the shape of buildings from satellite imagery. Along with the geospatial coordinates, address, and brand affiliation of the POI, Geometry data provides the shape of the place of interest, formatted as Well-Known Text (WKT) for easy mapping and analysis.
SafeGraph’s Geometry dataset also includes additional attribution, such as the presence of a parking lot in the provided polygon, building height, and spatial hierarchy information. We disclose whether or not each polygon is synthetic, which indicates whether or not the polygon is inferred from machine learning.
3. Spend
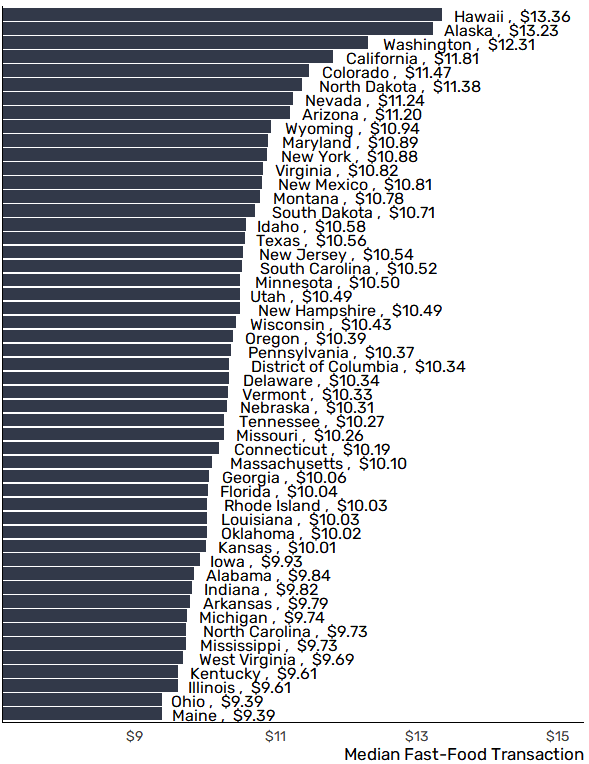
SafeGraph Spend provides aggregated and anonymized debit and credit card transactions at individual points of interest. We build this dataset by partnering with one of the largest transaction data providers, used by the world’s top financial institutions.
The data we source from our partner is consumer-permissioned and not tied to individuals. Rather than providing individual transaction amounts with timestamps, Spend data delivers aggregations of transactions taking place on specific dates at specific places. This enables users to analyze how spending is changing at different locations over time, and at the level of geographic granularity needed for their particular use case.