1.Consumer spending analysis at the transaction level exposes patterns that brand-wide averages often conceal.
2.Regional and store-level variations show that consumer spending analysis cannot be reliably inferred from national trends alone.
3.Separating spend per transaction from transaction volume reveals distinct drivers behind changes in consumer behavior.
4.Granular consumer spending analysis explains regional outliers that appear anomalous in aggregated reporting.
5.Linking Spend data with POI attributes strengthens location-specific insights and improves interpretation of spending trends.
ICYMI, SafeGraph recently launched Spend data. This dataset contains aggregated and anonymized information on debit credit card transactions by point of interest (POI). Other transaction data providers typically only offer brand-level insights, not store-level.
One strong use case for the data is breaking out sales revenue more precisely. Sure, you can look at a company’s annual report to get an idea of what its revenues are overall, but what if you want to know how that company is doing regionally? Or if there are any standout stores? Or maybe you’re wondering about opening a new location and are wondering where to put it.
There are meaningful differences between national and regional performance, and Spend data can help you uncover that.
Let’s take Walmart as an example and look at data on spend per transaction over the first nine months of 2021. This is all same-store data, in other words using only the Walmarts present in Spend data both in January 2021 and September 2021. Then, matching the way that Walmart does same-store analysis, we also drop any stores that opened in the most recent year, using the SafeGraph opened_on field.
Let’s start things off by looking at the national picture in the United States. How has Walmart fared throughout the first three quarters of 2021?
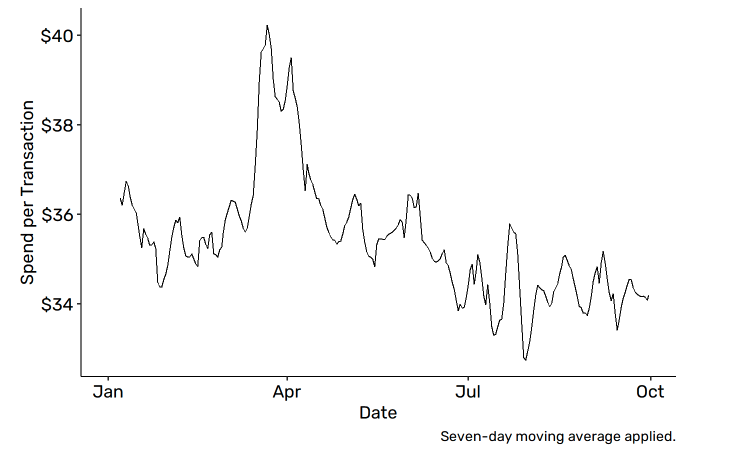
We can see a few things in this. First, and most obvious, is that there’s a pretty big spike in late March and early April, with spend per transaction jumping from about $36 to about $40, but it’s only temporary and we’re back down to $36 by May. Then there seems to be a slow and slight decline, ending up with per-transaction spend values of more like $34 by the end of September.
Notably, this is all based on spend per transaction. We can (and will) use this metric to look for Walmarts where people tend to spend a lot in each transaction, but this doesn’t necessarily mean that Walmart’s fortunes have looked worse over the year. The declining spend per transaction is accompanied by more transactions, to the extent that if we look at overall national Walmart spend, it’s up by 8.5% from January to September. This is nearly identical to the Walmart 8.4% same-store growth from January through October reported by the company.
But beyond the aggregate, Spend lets us break things down. In particular, let’s see whether spend-per-transaction seems to be evolving similarly over the year in different states.
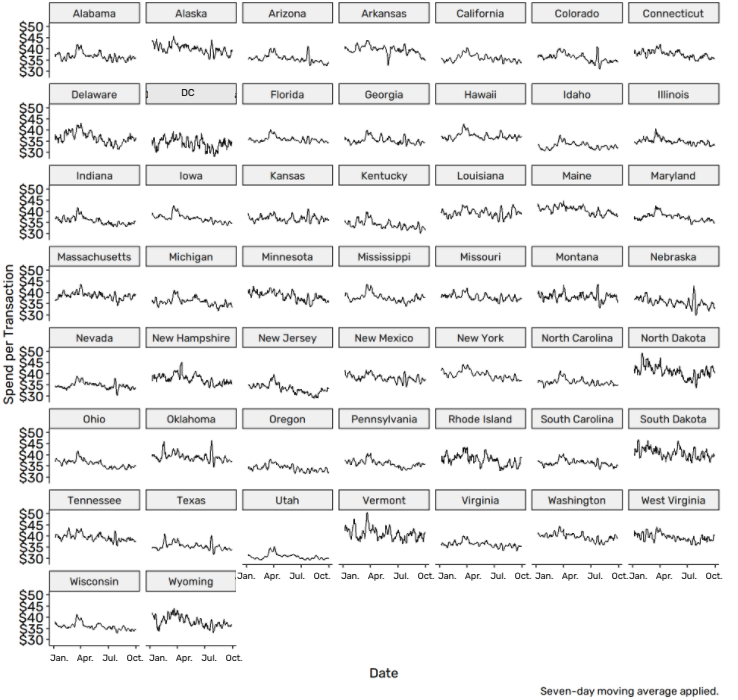
We can already see how much detail we have at our fingertips. And we can also see where some interesting trends seem to be popping out. North Dakota, for example, has an interesting dip in its spend per transaction appearing throughout June that doesn’t seem to be there for the other states. Let’s focus in a little more closely on North Dakota and its 14 different Walmart locations in the data.
Let’s take a look at the individual stores in North Dakota and see what might be driving this dip - is it widespread across all the North Dakota Walmarts? Is one store really taking a dive and the others are fine?
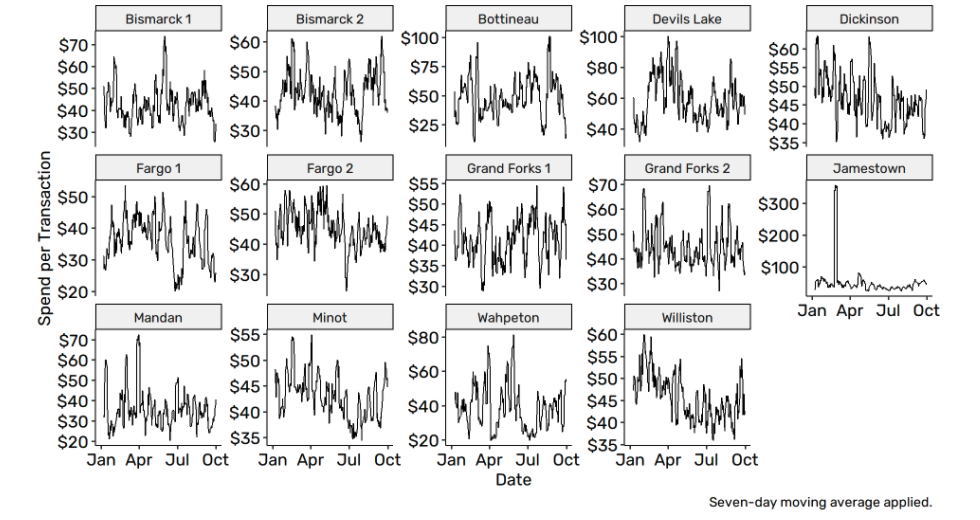
We see some interesting results like the enormous one-day spike in Jamestown, which might be an interesting story for another day. But for now we’re looking for a dip in July. Where did it come from? Not every store, it looks like. But both Fargo locations, Dickinson, Minot, and Wahpeton all seem to have this same sort of July-dip pattern.
We’ve pinned down three specific locations that seem to be driving the odd North Dakota behavior. What’s going on at these stores? Is this a regional thing? We can look at where the dip stores are relative to the others.

The dips appear to be spread throughout the state, but a lot of the activity is concentrated around Fargo in the southeast of the state, which includes both Fargo store locations and the Wahpeton store.
Let’s focus on those three then. What’s driving the change in spend per transaction? Less spend overall? More small transactions? Both? Let’s focus in a bit more narrowly around the July dip and separate these two things out.

We see two different stories here (and a third trail of bread crumbs we could follow on another day - what shopping bonanza is going on in Fargo 1 in May? Looking at finer grained data does tend to raise an infinite number of questions we’d love to follow up on). In Wahpeton, the dip seems powered by a drop in actual spend for a short period in July. But in Fargo, total spend seems pretty consistent, while overall transactions went up. People in Fargo were making lots of little purchases in July. If we’re willing to extrapolate a little further, we might be saying something interesting here about the effectiveness of Walmart’s 4th of July sales in Fargo as opposed to in other regions.
Getting national trends and statistics for revenues for different brands often isn’t too difficult (depending on which kind of brand you’re looking at). But often the questions we might be really interested in, and the real opportunities, are at finer levels of detail. Looking at Spend data lets us distinguish how spending patterns differ across different regions, or types of location.
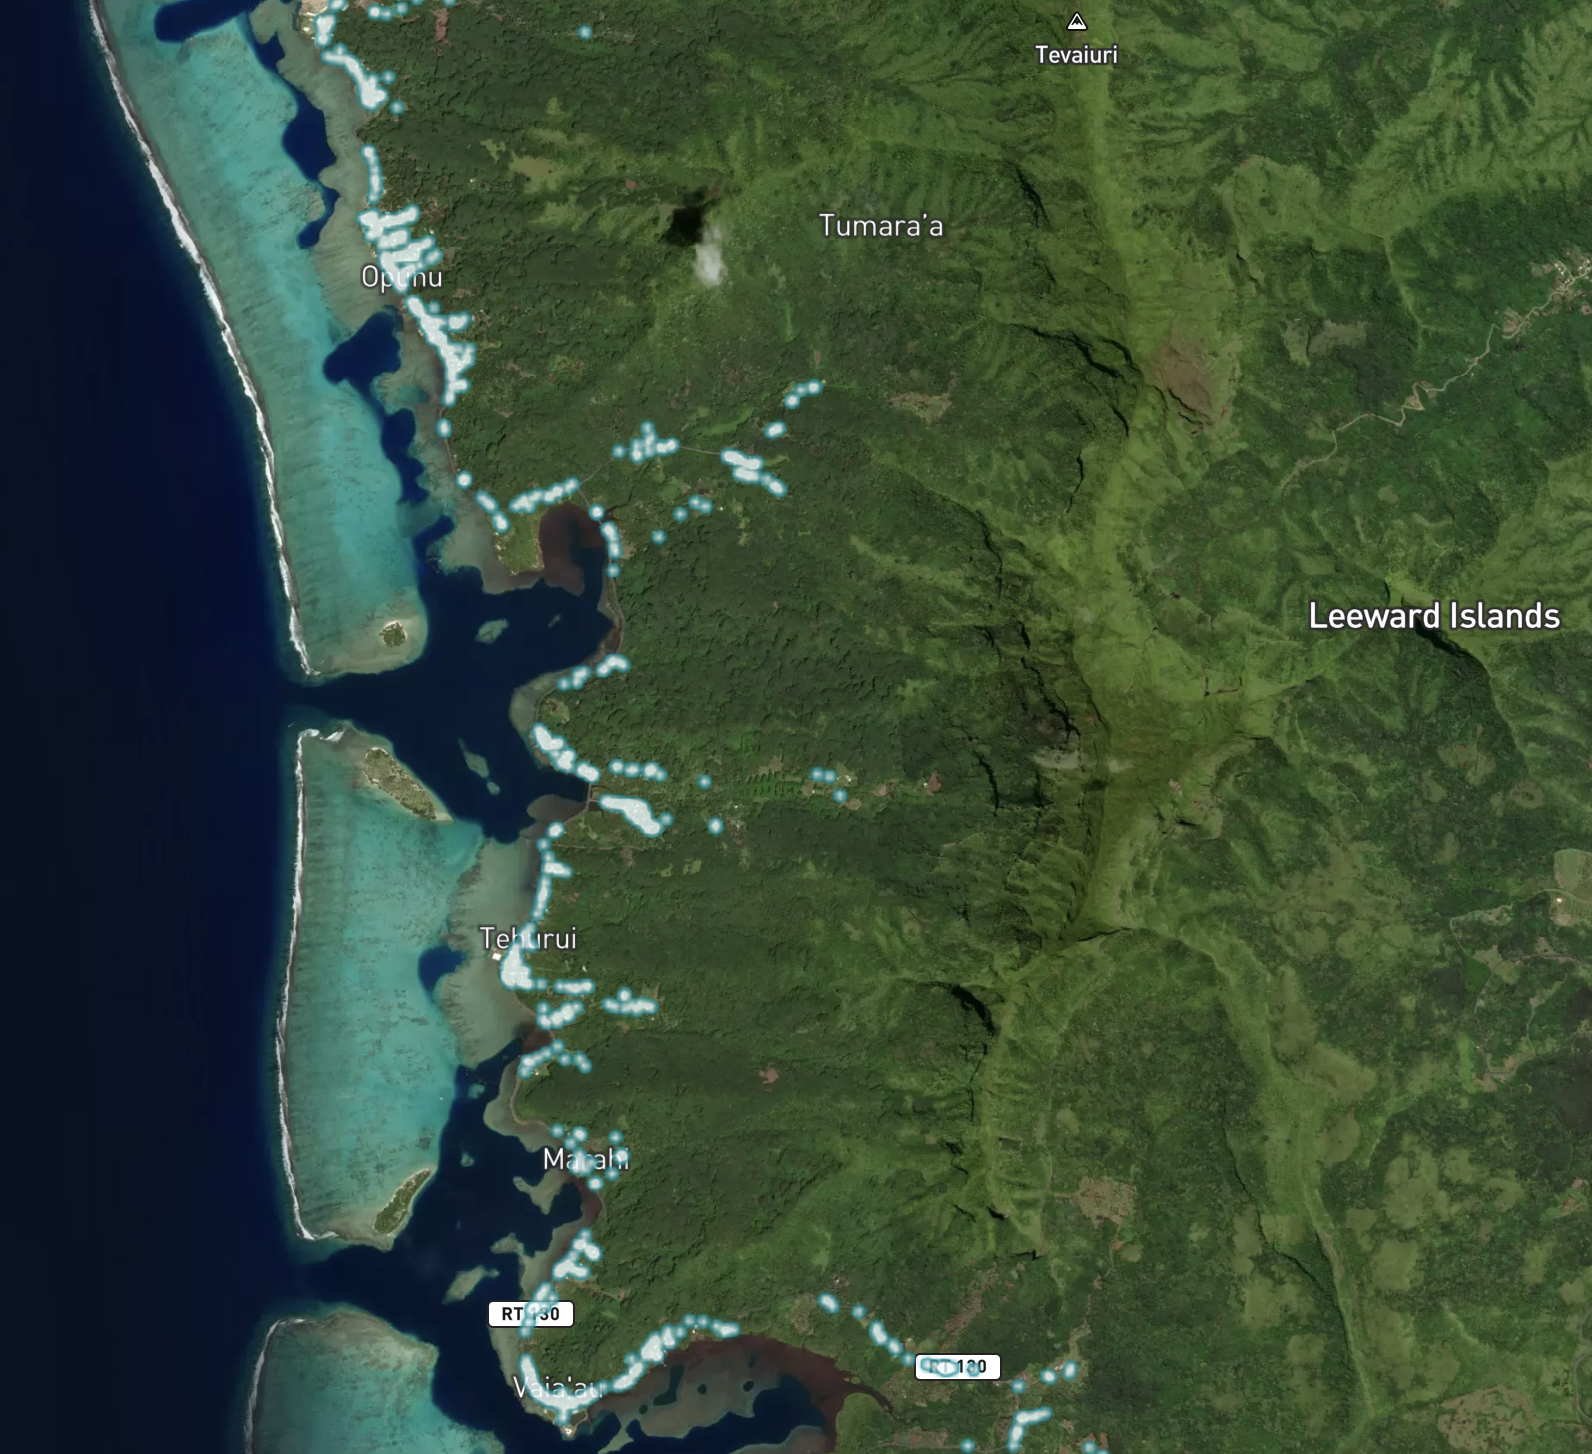
What do we mean by types of location? That could be anything to do with the different kinds of POIs. POIs differ by geography, as we saw on the map above. They also differ by all sorts of other stuff. How long they’ve been open, or whether they’re in a mall - three of our Walmart locations in North Dakota are a part of larger shopping centers, and none of these three had a July spend-per-transaction dip. Interesting!
There are a lot of possibilities, not just for broader trends, but information about individual locations, much of which could be explored directly by linking in SafeGraph Places, like we did here with the latitude and longitude of each of the Walmart locations for our map.
Schedule a demo to learn more about SafeGraph Spend.
1. What is SafeGraph Spend data?
Spend data is an aggregated and anonymized dataset of debit and credit card transactions mapped to points of interest.
2. How is Spend data different from brand-level transaction data?
Unlike brand-only datasets, Spend data allows analysis at the individual store level, enabling more precise regional insights.
3. Why analyze spend per transaction instead of total revenue?
Spend per transaction helps distinguish between changes driven by purchase size versus changes driven by transaction volume.
4. How does granular spend analysis help businesses?
It supports decisions around site selection, regional strategy, promotions, and understanding local consumer behavior.
5. Can Spend data be combined with other datasets?
Yes. Linking Spend data with POI attributes and location data provides additional context for interpreting spending patterns.