Maintaining timely, accurate, and reliable open and close data on POIs is crucial for numerous customer use cases, such as retail site selection, competitive analysis, and analyzing COVID-19 recovery trends.
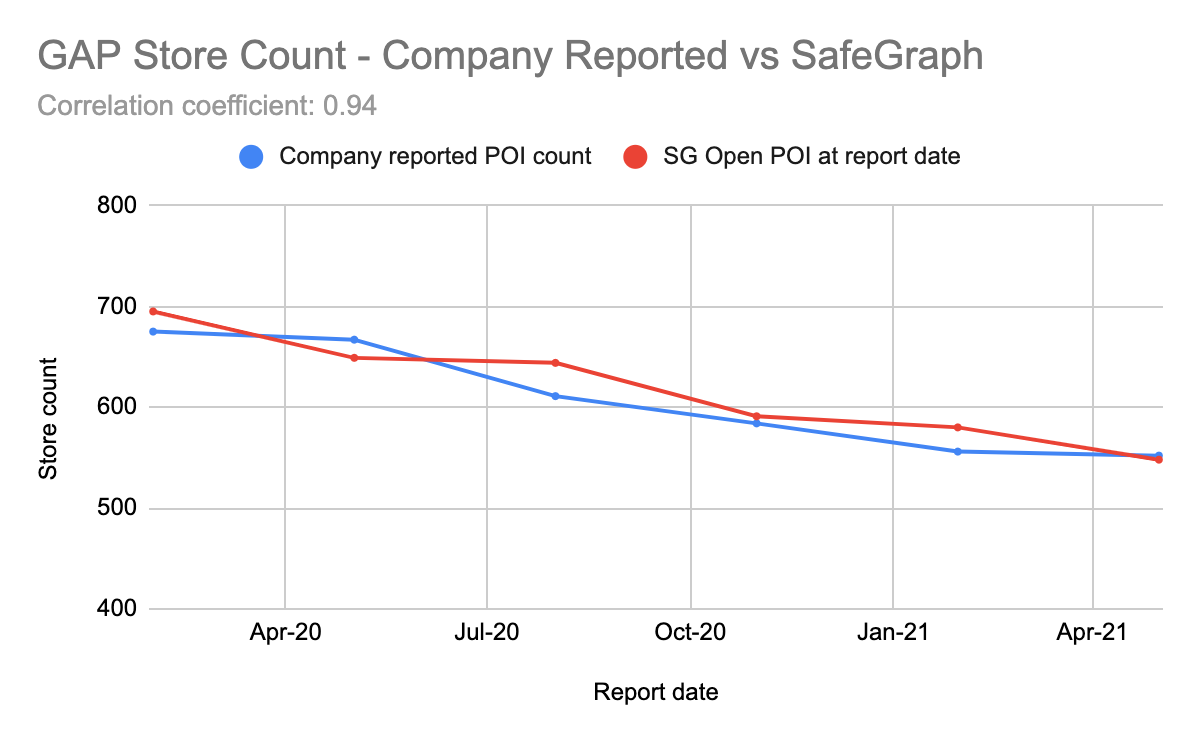
During 2020, many brands closed stores, while some were temporary due to quarantine requirements, some large retail chains such as Gap and Bed Bath & Beyond, signaled significant changes in their overall store footprint. To keep up to date with these changes, our QA processes were improved to ensure we could deliver timely and consistent reporting on closed_on dates.
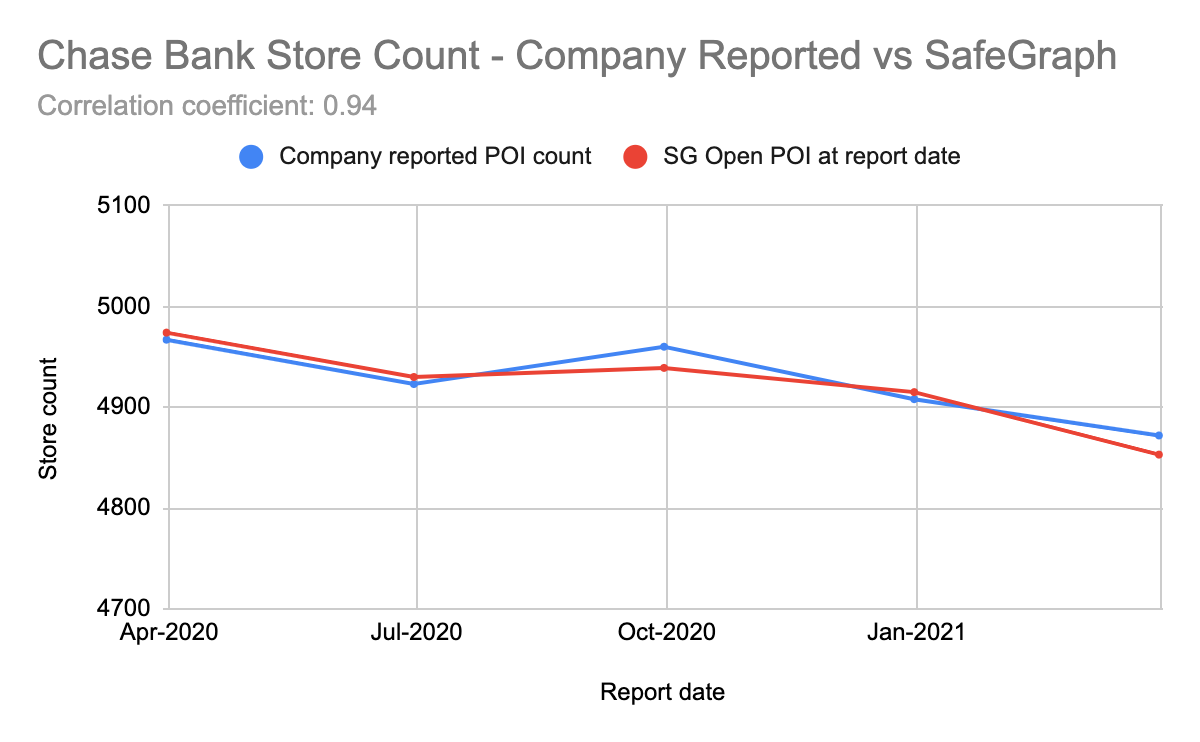
Other factors, such as industry trends, have also accelerated the pace of store closures, notable brands include Chase.
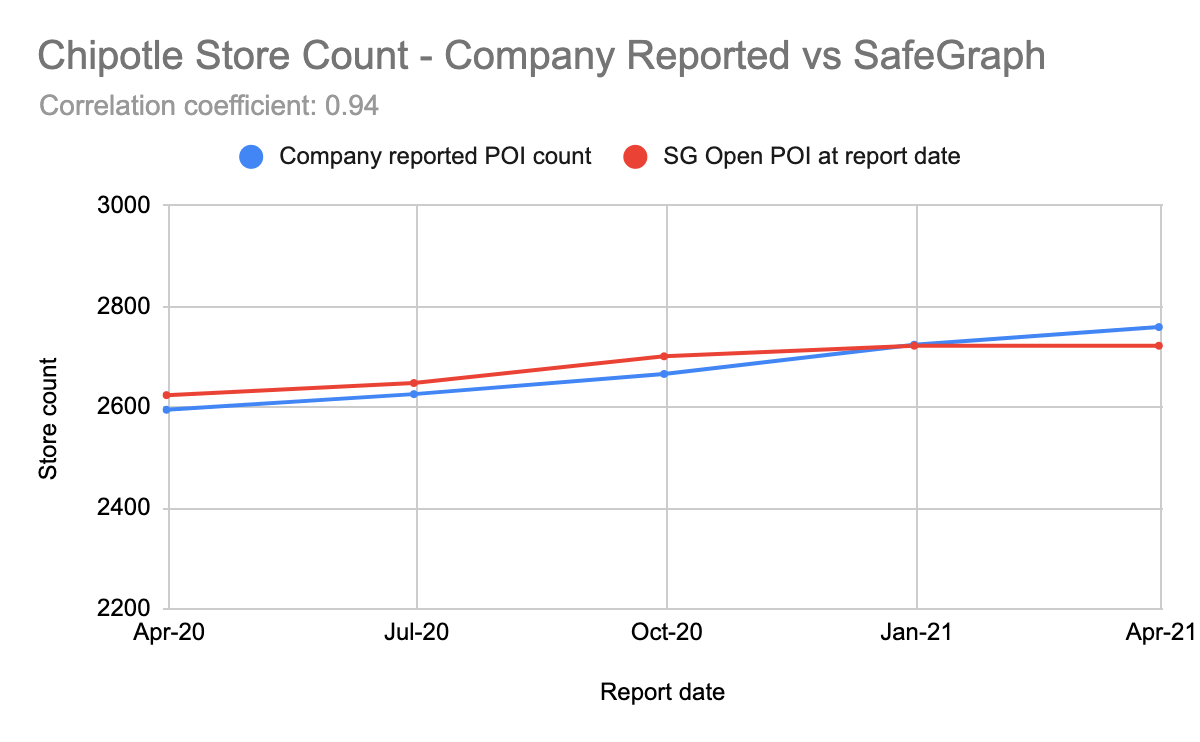
Conversely, as the COVID-19 recovery continues in 2021, brands such as Chipotle are reporting plans to increase store counts. The rising trend of digital sales and food delivery may reshape how these new stores operate.
The steps below can be used to extend this analysis for other brands:
1. Obtain company reported store counts from quarterly earnings reports found in SEC Filings or in the Investor Relations section of the company’s website (Chipotle). Take note of the countries included in the store count (US only or US + CA_, however SafeGraph currently doesn’t have POI counts for global store counts.
2. To measure the SafeGraph open POI count at the report date, use the most recent Core Places Release, filtering by brand and country if necessary. Take the sum of:
– Total POI count Minus
– POI where closed_on
– Minus POI where open_on > report date
3. Compare the company reported store counts against SafeGraph open POI count by plotting a graph and calculating the correlation coefficient. Note: some company reported store counts may include child brands, whereas SafeGraph has each brand individually (Albertsons includes 19 child brands such as Safeway, Jewel-Osco and Vons).
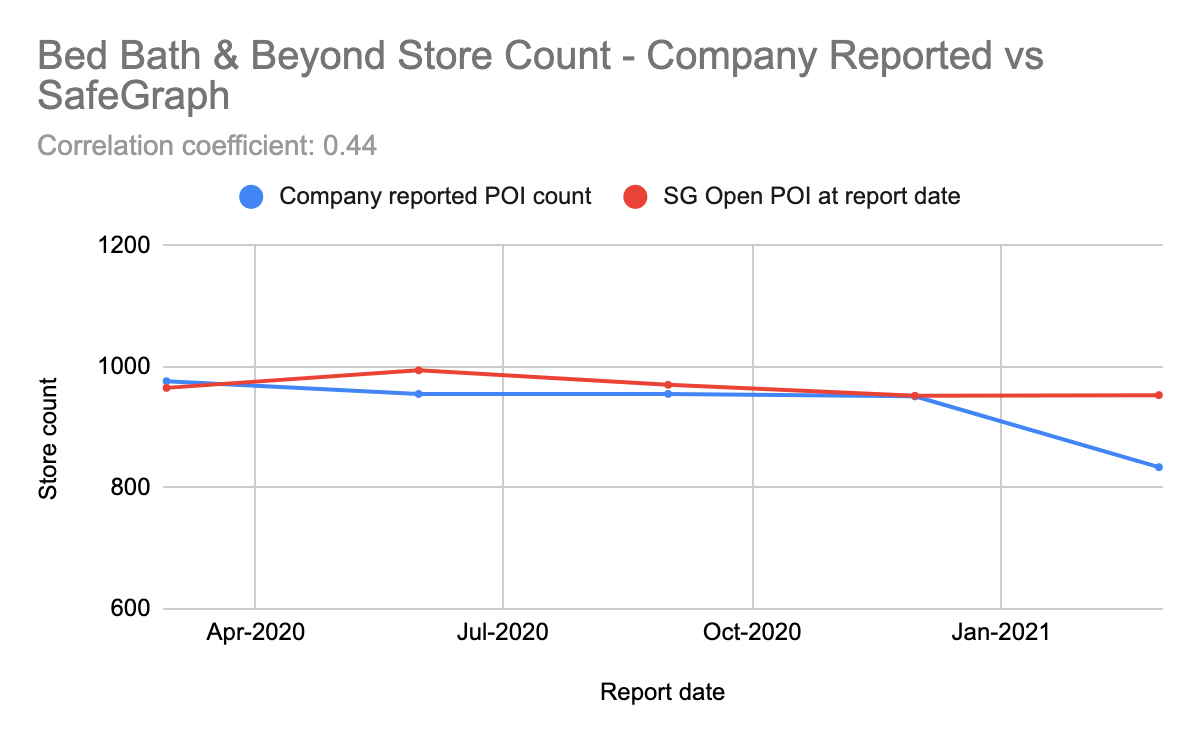
Determining if a store is temporarily or permanently closed can be challenging, as brands can change their store locator features without warning. In the case below, Bed Bath & Beyond closed some stores but they remained in store locator, with trading hours as “Closed” everyday and “CLOSED” in the name. Several brands use similar methods to indicate a store is temporarily closed and to avoid incorrectly marking these as permanently closed, we wouldn’t apply a closed_on date. To resolve the discrepancy here, we can update the logic for this specific brand and the new POI count can be reflected in the next release without impacting the logic and POI closures for other brands.
In addition to QA checks throughout our pipeline, SafeGraph also uses customer feedback to continuously improve our POI data. Errors in open/close dates or other attributes can be reported directly to the Product Team via our Feedback Tool.
To see the analysis in action, check out this spreadsheet with both working and raw data, then schedule a demo to get high quality POI data for your team.