90% of worldwide purchases are predicted to take place in-store versus online in 2025.
Source: Statista via CARTO
This may sound surprising. With brands like Instacart and Amazon, you could easily get everything online with minimal effort. But despite COVID and the increase in online shopping, CPG is still mostly an in-store experience.
When it comes to CPG companies leveraging geospatial data to make informed decisions for site selection and identifying areas of opportunity, mobility data has always been seen as a silver bullet - and that makes sense, right? Understanding how people move is essential to developing a successful CPG in-store strategy. It’s an essential factor in assessing where people are spending their time and money. The problem is that if CPGs are not measuring what mobility data is in relation to, they could be missing out on a lot of other factors that impact the “full picture.”
Many CPG brands overlook the importance of other geospatial data, which is ultimately detrimental to their strategy. Foot traffic is not the only thing CPGs need to be data-driven and successful. In fact, they will be unsuccessful if that’s all they use.
CPG companies want to know:
Analyzing POI data is the best way to answer these crucial CPG questions.
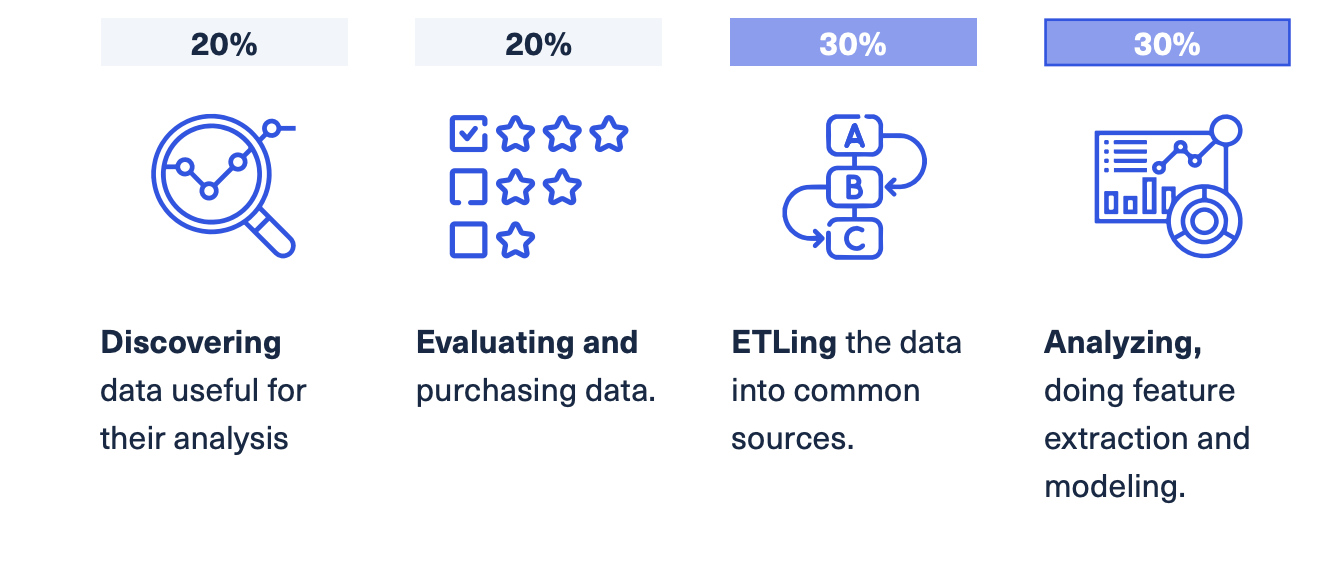
SafeGraph recently presented at CARTO’s Spatial Data Science for CPG and Retail event, exploring how CPG companies should be using and thinking about geospatial data in order to be successful. Here’s a recap.

Total addressable market (TAM) is the most common metric CPG companies use to reference revenue opportunity and best prioritize potential opportunities. For example, some may consider how many stores can theoretically carry a product across a specific city or region. If I own my distribution, I want to know where to put my product while ensuring I am not cannibalizing my other products or bleeding any revenue that I wasn’t aware of.
This is where the quality of points of interest (POIs) become important. With reliable POI data, CPG companies can map their current distribution and competitive landscape to identify areas of opportunity or risk. Geometry for those POIs are also important, particularly for geofencing and advertising. If polygons are not accurate, mobile pings may be associated with something totally irrelevant, resulting in wasted ad spend and a negative customer experience.
POIs and building footprints are constantly changing. We’ve seen in our data that store locations and brands ultimately have an expiration date. Whether it is 6 months or 100 years from now, there’s no permanence. However, it can be easy to see a store or park as being permanent.
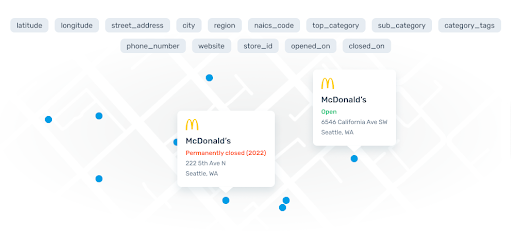
If you have a map with POIs of stores that sell a product from January of 2020, the landscape now looks completely different. SafeGraph Places data provides dynamic representations of how the world looks in a monthly cadence, to provide CPG brands with an up-to-date view of their markets.
To accurately depict these changes in landscape, we’ve added columns to our dataset that represent when a store or POI opened and which ones closed. We accurately track this through our ingestion pipeline, through different sources and data science algorithms to maintain the highest quality data possible. Within SafeGraph data, if you’ve noticed a new store or POI consistently appearing, that probably means a new brand has launched. If you see a POI consistently disappearing, that can give you a hint that a brand went out of business.

Geometry data, including building footprints with spatial hierarchy, helps CPG brands identify child and parent polygons - for example, a CVS within a greater strip mall. By pinpointing exactly where that is, CPG companies can assess the competitive landscape, how accessible the location is to consumers, accurately geofence to deploy mobile marketing, and finally - bringing in mobility data again - correctly attributing visits to that specific store.

Mobility data is useless without accurate POI and building footprint data to provide context. When all three datasets are combined, CPGs can understand the full picture when building and executing a successful strategy.