If you’ve heard of SafeGraph, you’re most likely familiar with our POI (point of interest) data for COVID-19 response. What if I told you that SafeGraph’s Geometry data is the crux that makes it all possible? You know – the shapes depicting the places we care so much about? Without these obscure little polygons, SafeGraph products would not hold the same value as they do today. Below, we’ll discuss where these polygons come from and why they’re so useful.
Unfortunately, geometry data doesn’t grow on trees – nor does it grow on maps, apps, or S3 buckets for that matter, and this makes our mission to provide a “best fitting” polygon for each record in the SafeGraph Places dataset an incredibly tall order. To further complicate matters, the definition of a “best fitting” polygon varies by POI type and can range from a building footprint (or even a slice of a building footprint) to a massive shape containing parking lots, land, and several buildings within its bounds – like a college campus for example. We obviously don’t tackle all of this alone (we’re ambitious – not crazy) and are fortunate to be in business with some amazing partners who specialize in curating geometry data of varying criteria. In most cases, we prefer to have polygons extracted from aerial imagery using the latest methods in object recognition and AI. We recognize that this is the future of geometry data sourcing and has the best chance of scaling rapidly. In other cases, and especially for places with complex requirements, we prefer to have polygons hand drawn. This is still the most sure-fire way to source an accurate polygon, and that fact is unlikely to change in the short term.
For some, geometry data is already useful in raw form. Polygons offer a robust visual representation of places and can aid in use cases ranging from square footage calculations to site selection. But for others, geometry (and the metadata inferred from it) really proves its value when used to derive additional geospatial products. Externally, our customers also use SafeGraph Geometry data as a “blueprint” of sorts to derive their own foot traffic insights.
So, in the spirit of transparency, we’d like to walk through the metadata we build into our geometry as well as our best practices for putting that metadata to work.
For every place, we always want to answer three key questions:
1) Does this place encompass other places?
2) Is this place completely enclosed inside of a larger place?
3) How many places belong to this polygon?
Let’s take these one at a time…
1) Geometry Data & Spatial Hierarchy: Does This Place Contain Other Places?
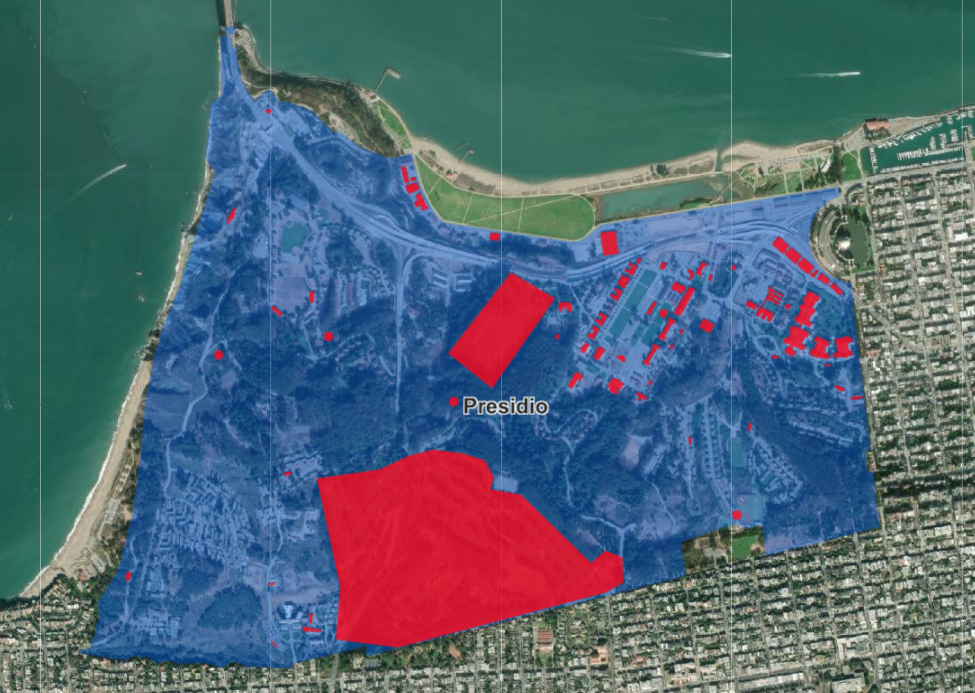
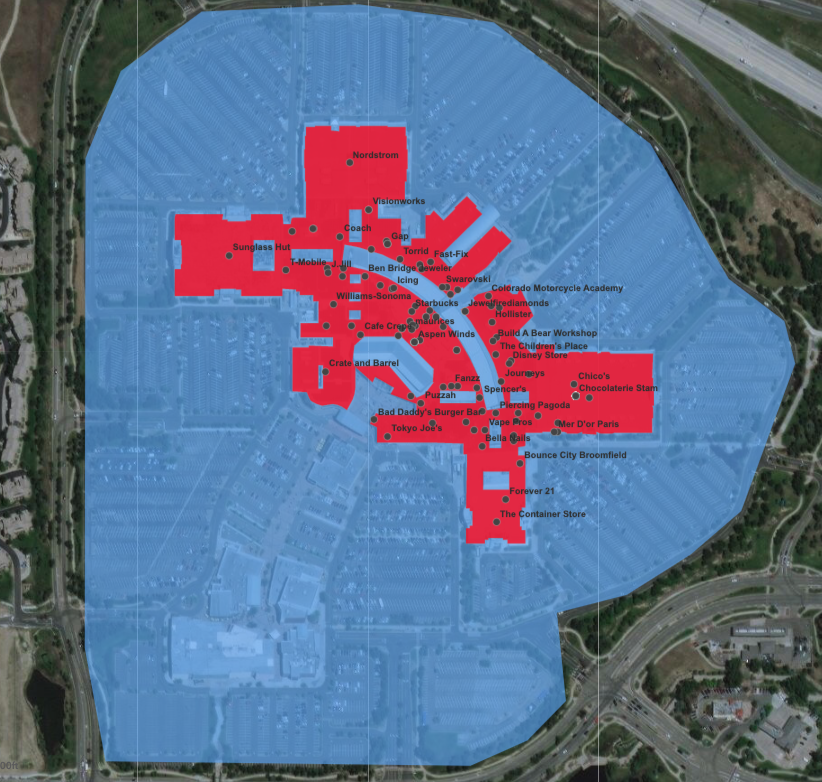
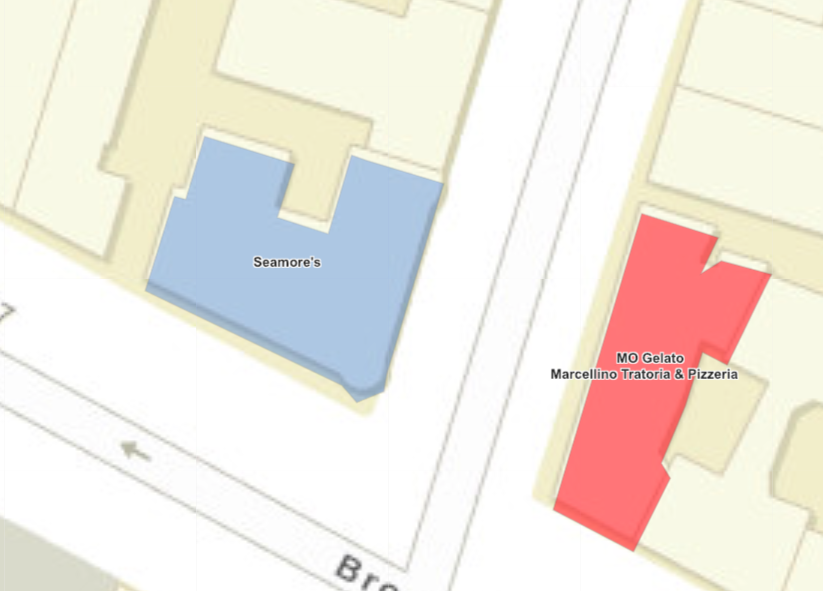
The real world is full of places that contain other places, and these relationships exist in many forms. Some places are massive and represented by a broad, expansive boundary, and these places encompass several, if not hundreds, of smaller places within their borders. An outdoor shopping mall, for example, encompasses many POIs within its footprint, and so do hospitals, college campuses, ski resorts, stadiums, casinos, etc. In other cases, a single building may represent the footprint of a POI, but it still might contain other POIs within. A Walmart containing a Subway is a canonical example of this, and we are also interested in understanding these relationships.
In any case, we identify spatial relationships (what we refer to as “spatial hierarchy”) by measuring polygon overlap. For each pair of overlapping polygons, if the larger polygon contains at least 80% of the smaller polygon, and if the larger polygon is also of a particular POI category, then we mark it as the “parent” of the smaller polygon. It’s important to restrict parent POI candidates to a specific set of categories or brands so that we’re not solely reliant on polygon precision to determine spatial hierarchy. For example, we want airports to be parents when overlapping other POIs, but we generally don’t want cafes to be parents if overlap exists and the cafe happens to be the larger of the two polygons. See our Places Manual for a complete list of POI categories that are eligible parents. We flag these relationships in our geometry data by setting the “parent_placekey” of the smaller POI equal to the “placekey” of the larger, encompassing POI. We colloquially refer to the larger, containing POI as the “parent” and the smaller POI as the “child.”
2) Enclosed Polygons: Is This Place Completely Enclosed Inside of a Larger Place?
Within spatial hierarchy, we are interested in further classifying parent/child relationships. In general, we want to know when a parent POI encompasses its children completely indoors vs. on open air grounds. For example, a ski resort boundary may enclose a restaurant midway up the mountain, but the ski resort boundary itself is not an indoor enclosing structure. On the other hand, an airport containing a Starbucks completely encloses that Starbucks indoors. As a general guideline, if you must enter another structure to arrive at a POI, we want to be aware of that fact, and we set the “enclosed” column in our geometry data to “true” wherever that exists.
Similar to determining eligible parent POIs, we rely on categories to distinguish enclosing vs. non-enclosing spatial hierarchy relationships. See the enclosed section of our Places Manual for a complete breakdown of the spatial hierarchy relationships we treat as “enclosing.”
3) Polygon Class: How Many Places Belong to This Polygon?
It’s important to distinguish when geometry data reflects the shape and size of a POI’s real world footprint and when it does not. In most cases, each polygon represents the unique footprint of a single POI, but in some cases, a precise polygon for a POI does not exist (or is not discernible through our sourcing methods), so the only polygon available may be too large and could represent several POIs.
When a polygon reflects the true shape and size of a unique POI, we give it an “OWNED_POLYGON” value in the “polygon_class” column. This means the polygon represents that unique POI, but there could be child POIs within its borders attached to the same polygon. In other words, if a single POI maps to a distinct polygon (excluding that POI’s children), then polygon_class = “OWNED_POLYGON;” otherwise, polygon_class = “SHARED_POLYGON.”
We exclude children from influencing their parent POI’s polygon_class because there are cases where a unique polygon does not exist for each child POI, and the child POIs most likely share the same polygon as their parent. In these cases, it does not mean that the polygon is a bad representation of the parent itself. A canonical example of this is a Nike store inside of a shopping mall. If we don’t have a good polygon for the Nike store, then the Nike store likely shares the same polygon as the mall. Despite the fact that multiple POIs are attached to this polygon, the polygon is still representative of the mall’s shape and size, so the polygon_class for the mall POI = “OWNED_POLYGON” and the polygon_class for the Nike store POI = “SHARED_POLYGON.” Read more about polygon_class in the Places Manual.
At SafeGraph, we focus on a deep understanding of the physical landscape and we hope to share this context with our partners who set out to do the same.
What details are we missing? What are we getting wrong? What other metadata would be useful for you? Check out our docs site to learn more.