To grow your business, improve the customer experience, and retain and engage your customers, you need to understand who they are and where they come from. Catchment areas, or trade areas, allow businesses to understand where their visitors are coming from, and gain deeper insights into who they are and their behavior.
Before we explain the best methods for calculating catchment area and the best tools to use, we’ll explain what a catchment area is and why catchment area analysis is so important.
A catchment area, or trade area, is the geographic area that a business, service, or organization attracts its customers from. Catchment areas can be defined by distance, by travel time, and by mobility patterns, allowing you to analyze where foot traffic comes from in a variety of ways.
Catchment areas are often used to better analyze foot traffic and store visit rates. To learn more about how to perform a catchment area analysis, check out our ultimate guide to trade area analysis.
For businesses, catchment areas show you where your customers come from and indicate the level of customer engagement in different areas near your business. Catchment areas can be used to analyze trade areas of your business, painting a picture of the coverage of your store locations, the competition in your area, and the overall pull of your store locations.
This makes it extremely easy to compare your own store locations against each other, competitor locations to your locations, market saturation, and more.
In geography, a catchment area is an area of land that collects water after rainfall, typically bounded by hills. Water flows down into these areas and collects into rivers and streams. These areas are useful for analyzing a geographic area, as it aims to understand waterfall and flow in the area.
Since water flow impacts much of the region's geography, foliage, and ecosystem, this is an important lens for analyzing an area. This helps inform development of drainage basins and water flow. Trade area analysis - or catchment analysis - for businesses is based on this same concept.
Catchment areas are often used by cities and government organizations to determine boundaries, such as school districts and the coverage of hospitals and health care facilities.
Communities determine who can attend schools by defining school districts. To do this, they use catchment areas based on distance and travel time. Similarly, hospitals and other public safety institutions can ensure that people have access to the services close to them.
Catchment zones are simply catchment areas, but this term is commonly used to refer to boundaries used in school or government catchment area analysis. They are used to define zones or boundaries for people’s reference - such as which school district they belong to, which hospital is within an ambulance's service area, or the areas served by specific subway stations.

While catchment areas in trade area analysis will often change depending on what you want to analyze, catchment zones are often fixed boundaries of analysis. For a business, you may want to view catchment boundaries by different travel times. For school zones, you want defined boundaries that remain relatively fixed. Catchment zones are also useful when examining multiple trade areas that need to be identified separately but analyzed together.
Catchment area analysis is the process of analyzing where your customers are coming from and who they are. It involves identifying the trade area of your business and digging into demographics, POI, and other data to understand your customers and their behavior. This includes identifying competitor locations.
It’s extremely important to do a catchment area analysis for your store locations for a number of reasons:
Trade area analysis should be a regular practice for your business, and is especially important when making big decisions about where to open new stores or close existing locations.
When it comes to defining your trade areas, there are a number of ways to do this depending on what you are trying to learn. Below, we briefly explain what these three methods are:
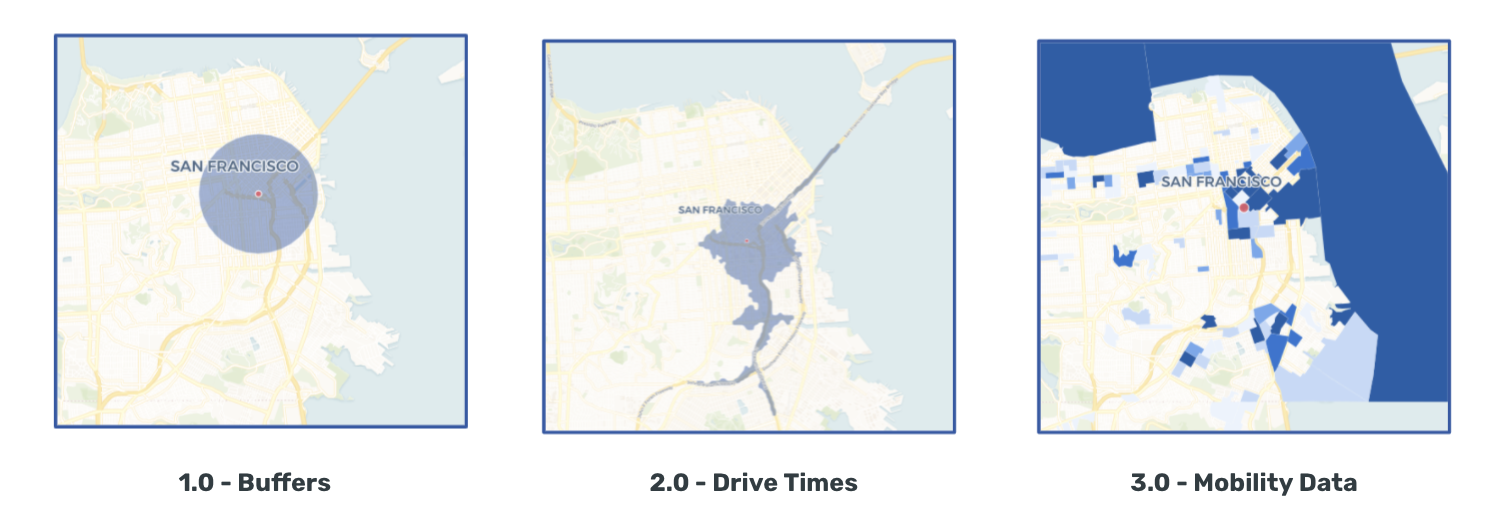
For a detailed breakdown of each of these methods, see our full explanation of the 3 methods of calculating catchment areas for trade area analysis.
The most important tool for identifying your catchment area is the datasets you’ll use. This information has to be reliable and accurate for your catchment area analysis to be of the most value to you.
Below, we cover where to get data for catchment area analysis and how you can use this data for catchment analysis.
What this is: SafeGraph offers point of interest (POI) data perfect for catchment analysis. With detailed information on a variety of locations, SafeGraph data can be used to gain information on not just your store performance, but that of your competitors. Even better, you can leverage this data to visualize your catchment analysis with a trade area analysis map.
Why you need this for a catchment analysis: Your catchment area analysis is only as valuable as the data you use for these analyses. To create the best catchment area maps and ensure you are performing the best trade area analysis possible, be sure to use high-quality, reliable data that is easy to work with.
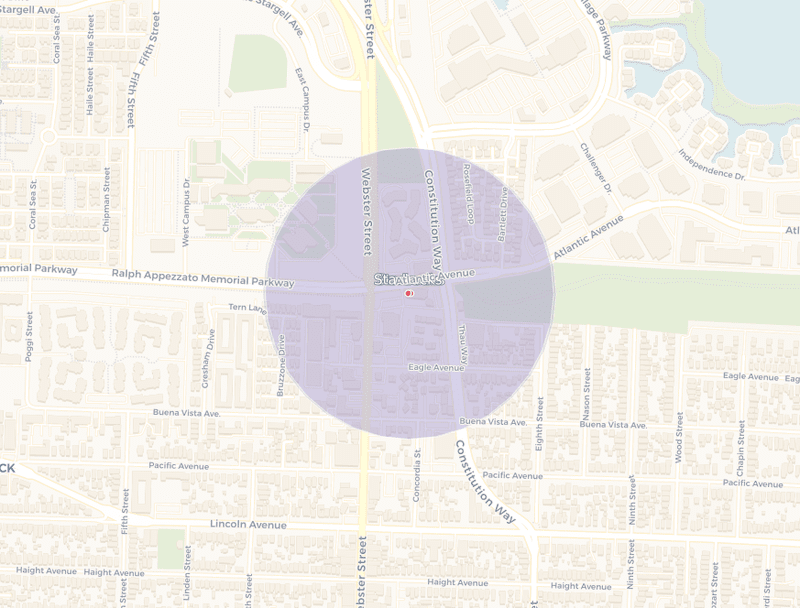
What this is: Buffer trade analysis involves creating a buffer zone (by distance) around your store locations, indicating the area for analysis. GIS and BI tools such as CARTO, Esri, Tableau, Domo, and AWS all facilitate this type of analysis, making it easy to define buffer trade areas for your store locations.
Why you need this for a catchment analysis: Buffer trade areas are a simple way of determining where your customers are coming from, and initiating this analysis. Based entirely on distance from your store locations, these buffer zones are the most basic form of catchment area analysis.
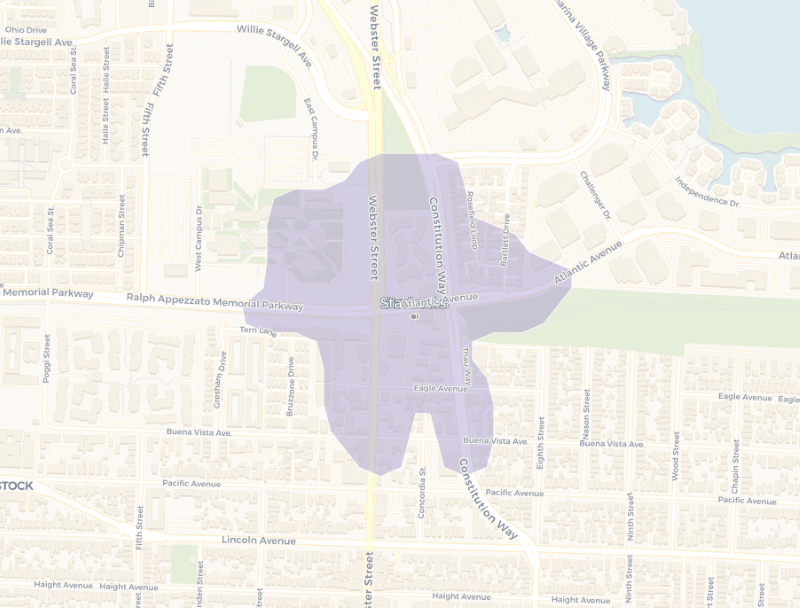
What this is: Drive and walk time catchment analysis involves analyzing trade areas based on the travel time it takes to get to the store location by either walking or driving. Business Intelligence and GIS solutions enable analysis by turning raw data into visualizations that are easy to interpret and gain insights from.
Why you need this for a catchment analysis: Drivetime and walktime trade area analyses are extremely important for understanding how easy it is for customers to get to your store. This paints a clear picture of how accessible your store is to your customers and is especially important if your business sells items that require people to have a vehicle (i.e. big items like furniture, etc.).
What this is: Mobility catchment area analysis involves analyzing trade areas based on mobility patterns data. This allows you to see your trade area based on the mobility patterns of customers - and potential customers - in the areas around your business. You can leverage this data to better understand your customers, their demographics, and their behavior. Data visualization is made possible by using BI and GIS solutions.
Why you need this for a catchment analysis: Mobility trade analysis gives you deeper analytics than a standard buffer analysis, as it shows where people are actually going. By using mobility data, you can also derive demographics data such as age, income, education levels, and more. All of this gives you deeper insights to draw from for your decision-making process.
Understanding and analyzing your businesses catchment area(s) is essential to harnessing the full potential of your location data, giving you an edge over your competitors, and allowing you to make better decisions about your store locations.
You can then use this information to more effectively market to your customers, saving money and effort marketing to customers that are outside of your local area and won’t visit your stores. SafeGraph has a variety of datasets with enriched point of interest (POI), empowering you to understand where your customers come from, how you stack up against competitors, and manage your store locations effectively.