Q2 2026 Accuracy Snapshot (April Places Release — Honolulu, HI benchmark zip codes)
Metric | Value | Change vs. July 2023 |
Real Open Rate (overall) | 70% | ↑ 4pp |
Coverage Rate vs. Google (overall) | 86% | ↑ 7pp |
Real Open Rate — Urban (96815) | 68% | — |
Real Open Rate — Rural (96712) | 75% | — |
Coverage Rate — Urban | 84% | — |
Coverage Rate — Rural | 98% | — |
Total global POIs | 78,038,621 | +1.86M this month |
New brands added (May 2026) | 393 across 133 countries | — |
Note: Coverage Rate can exceed 100% when SafeGraph has more verified open places than Google in a given zip code. Arts, Entertainment & Recreation currently sits at 123% coverage, meaning SafeGraph outpaces Google in that category.
Fast forward to the 2024 Super Bowl. Patrick Mahomes is trying to become the first QB since Tom Brady to repeat and he’s up against the Dallas Cowboys, who miraculously didn’t choke in the playoffs. A giant watch party is scheduled at Jerry World (the Cowboys’ home stadium, Placekey: zzw-222@5qw-vxp-h3q). You run a sports betting side hustle and are modeling each team’s expected points to decide whether to bet on or against the spread. Your method is bottoms-up: take every play from every game, assign it a situational success rating, and predict points scored based on the aggregated ratings.
Before you start modeling, you need to distill each game into a CSV. Then comes the hard part, assessing data quality. What if you were missing the play where the Cowboys’ third-string corner had a pick-six against Jalen Hurts in the NFC Championship? Each row is a play and each column holds the down, distance, time, personnel, yards gained, and description. How do you assess the “quality” of this dataset?
Let’s explore: Do you have rows for all the plays that happened? Are there extra rows from other games or seasons? What should you do about duplicate plays? Or the down just being wrong for a certain percent of rows? But whoops, one game has the distance column entirely null throughout the entire file. And your data provider didn’t include the time column until Week 7 – who knows what happened there, probably an intern. So are you ready to place your bets?
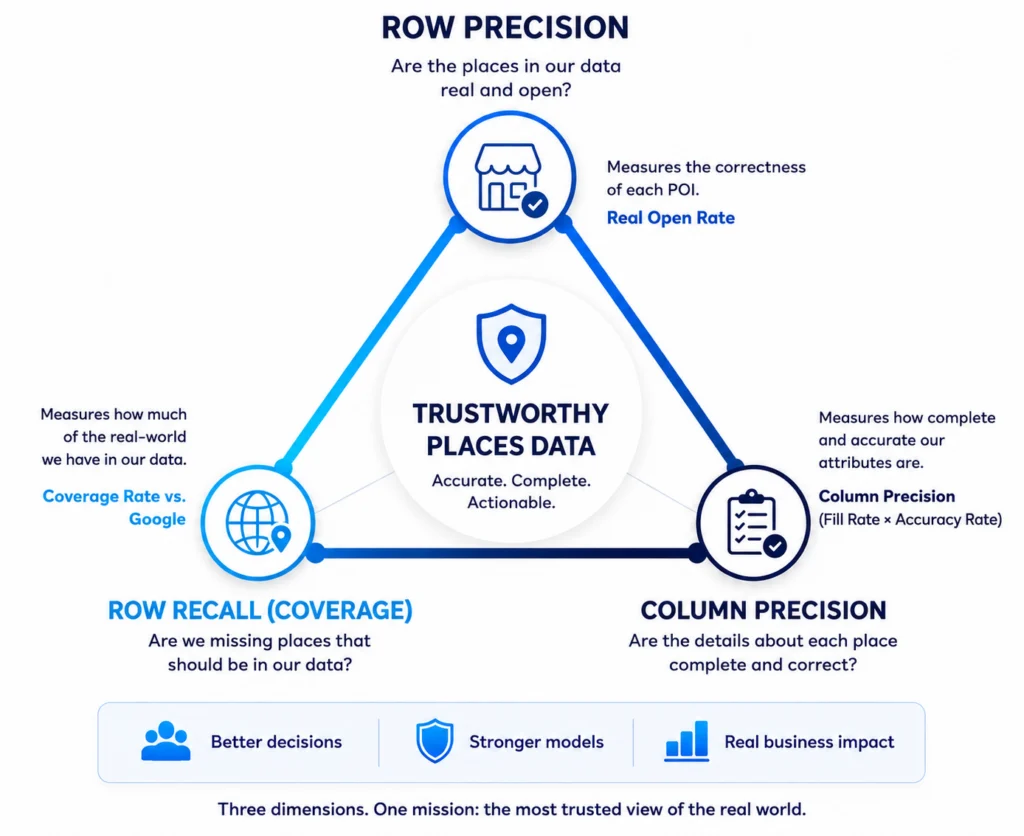
Clearly data “quality” is a multi-faceted and hard problem. As a data-only company, we care immensely about addressing it. So much so that we have spent months thinking about how to bucket different quality problems, which fixes will have the biggest impact for our customers, and how to communicate improvements to the market. We have narrowed in on a three-pronged framework and started in the US.
Row Precision assesses whether each POI (row) in our data truly exists and is marked open when it should be. We call this the Real Open Rate. As of Q2 2026, our Real Open Rate sits at 70% overall, 68% in urban zip codes and 75% in rural zip codes.
Row Recall (Coverage) assesses how much of the universe we have in our dataset, often referred to as “Coverage.” Coverage questions come up from prospects and customers all the time. We benchmark against Google. As of Q2 2026, our overall Coverage Rate is 86%. In some categories, we now exceed Google: Arts, Entertainment & Recreation sits at 123% coverage, and Other Services at 100%. We also break this out by NAICS code on the Summary Stats page.
Column Precision assesses fill rates for select columns and their correctness.
Column precision = fill rate × accuracy rate.
For example, a website’s column with 70% fill and 90% verified accuracy yields a column precision of 70% * 90% = 63%. These metrics are published quarterly; all truth sets are created manually.
This radical transparency about data quality is unprecedented in the POI industry. Below we’ll discuss row precision and row recall in detail, including our process, tradeoffs we considered, and what to expect going forward.
Row Precision
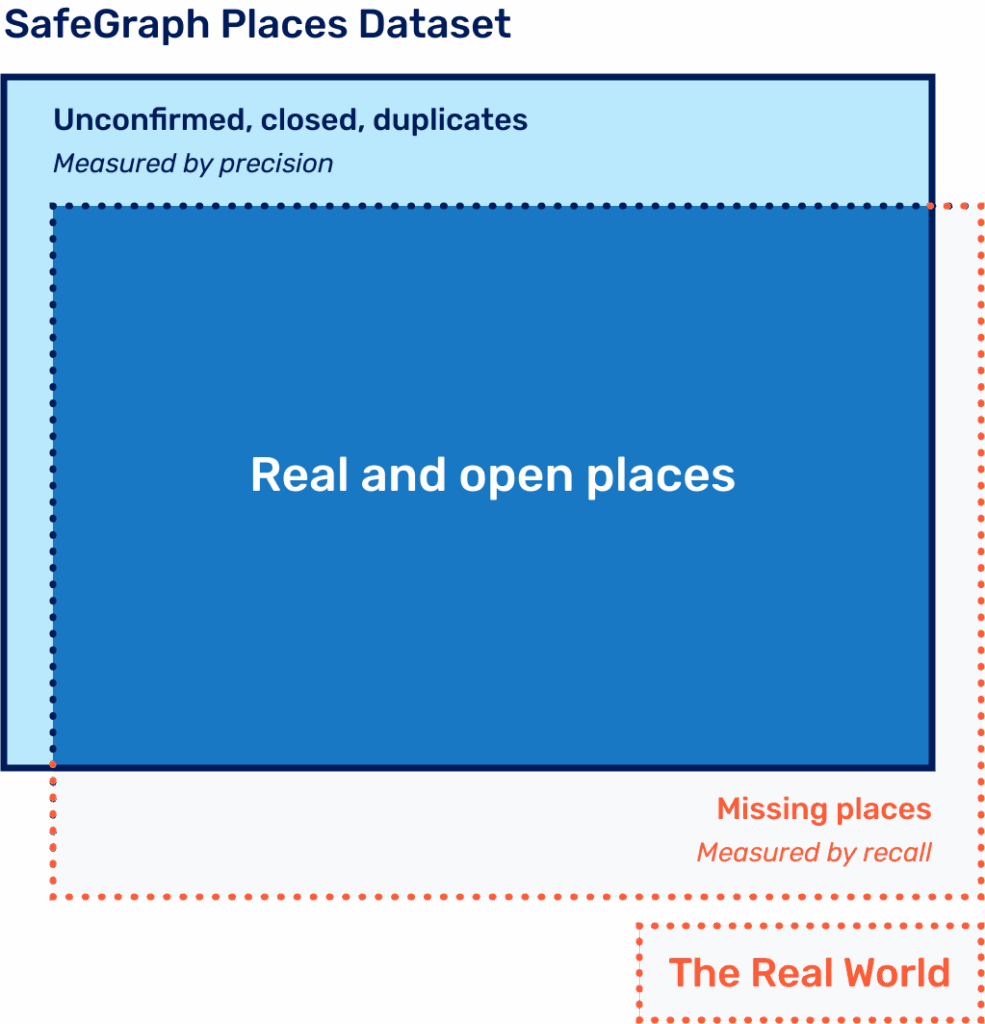
You’d think that determining if a POI is real would be simple. If we had Santa’s ubiquity, we would check each one individually in a single night. But alas, our reindeer are sleeping, and we need to use the internet and scalable methods for verifying each of our 80+ million global POIs. A SafeGraph POI falls into one of four mutually exclusive categories: Real Open, Unconfirmed, Closed, or Duplicates. Our north star metric for this prong is Real Open divided by Total Rows.
Real and Open Places
Consider a clear Real Open POI: Open Range Steakhouse at 241 E Main Street in Bozeman, MT. A quick search reveals a first-party website, an active Facebook page, multiple Google reviews from the past month, and recent Yelp reviews. There’s also an article about country music star Gavin DeGraw and his brother buying the restaurant. This one is easy to classify as Real Open.
Next, let’s look at a now-removed Unconfirmed row: a POI named “Phantom of the Opera.” That’s a play. Even though it may have a claimed Yelp page or its own website with an embedded map widget, it’s not a physical place. The Booth Theater where it’s performed? Absolutely a place, and already in our dataset (Placekey: 227-224@627-wbv-kcq). The line for the play itself gets filtered as Unconfirmed. To understand where these edge cases get genuinely tricky, see our piece on 4 Weird Edge Cases Which Confuse Even Humans (Places Data).
Then there’s a Closed POI: Mountain View Care Center at 205 N Tracy Ave in Bozeman, a nursing home that, according to multiple published articles, closed in 2020.
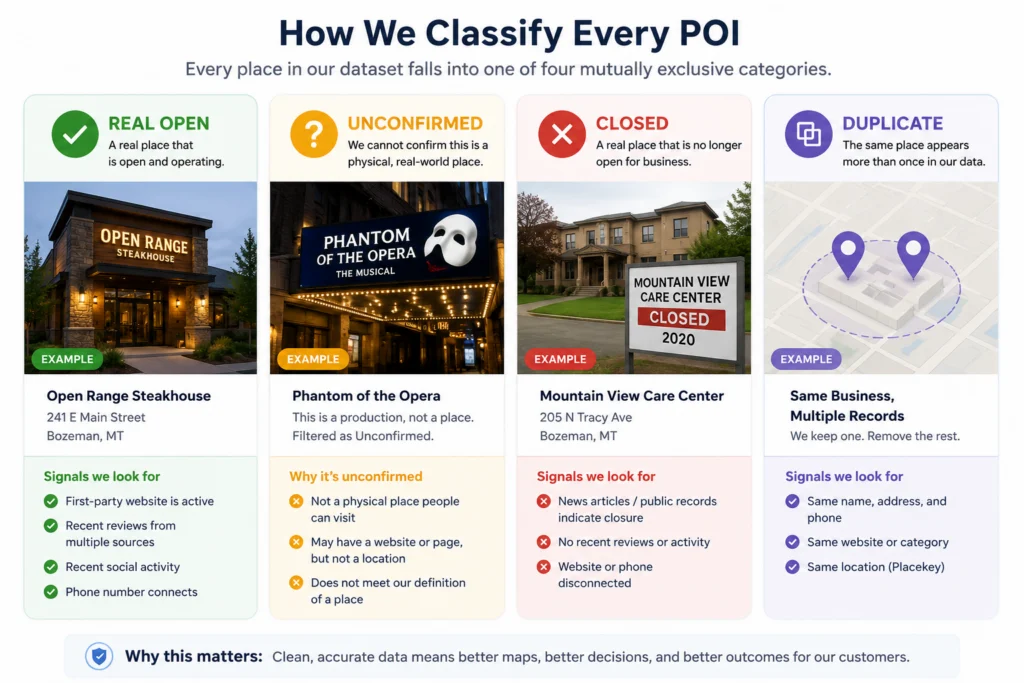
Duplicates should be fairly self-explanatory. If we find a POI represented twice, we remove one. Recent work, like our May 2026 update to motorcycle & ATV dealer merge logic, is a good example: multi-brand dealerships that previously appeared as separate POIs by brand are now consolidated into a single, accurate record.
Between the clear-cut cases lie significant gray areas. We addressed these ambiguities one at a time, with SafeGraph team members manually verifying thousands of POIs. The TLDR: when we classify a POI as Real Open, we look for 1) a first-party website where data originates, 2) several recent reviews, or 3) confirmation that they pick up the phone.
Real Open Rate – Progress Over Time
Real Open Rate – Progress Over Time
Release | Real Open Rate |
March 2023 | 60% |
July 2023 | 66% |
Q2 2026 (overall) | 70% |
Q2 2026 — Urban | 68% |
Q2 2026 — Rural | 75% |
Google (parity benchmark) | ~60% |
Our March 2023 release had a Real Open Rate of 60%. Even Google was at a similar level at the time, and other competitors trailed further behind. We prioritized identifying and filtering Unconfirmed POIs. After manually classifying around 30,000 POIs to generate a truth set, we trained a machine learning algorithm using attributes and metadata, websites, category, region, reviews, and sources, to predict the likelihood that a POI is Unconfirmed or Real. We called this concept the “IRL factor.”
Once all POIs were assessed, we set category-specific thresholds to balance precision and recall tradeoffs. In July 2023 we reached 66%. By Q2 2026, continued investment in source quality, merge logic, and closed-POI detection has pushed that to 70% overall, with rural areas performing notably better at 75%, reflecting improved sourcing in lower-density geographies.
Each quarter, we publish our Real Open Rate on the Accuracy Metrics page, broken out by urban and rural benchmark zip codes and by NAICS category.
Row Recall
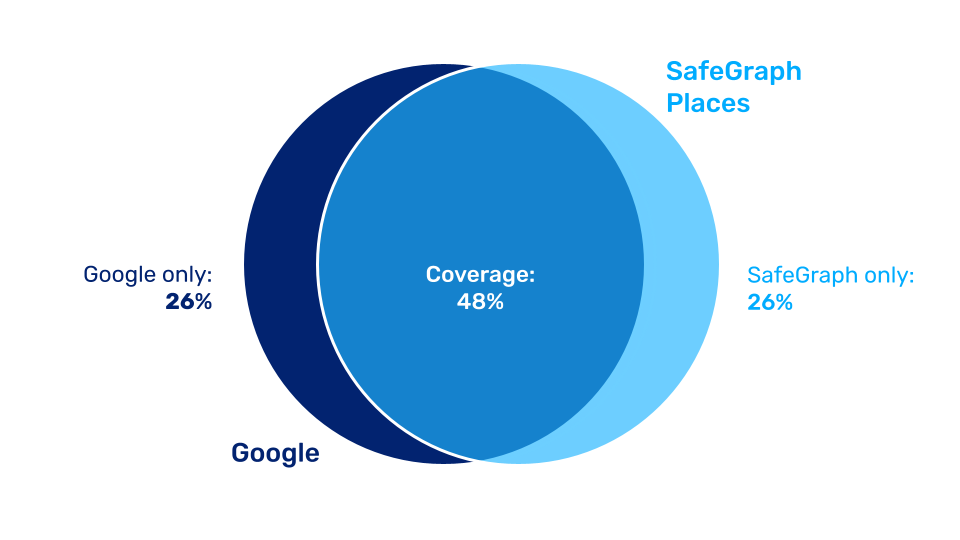
Next, let’s talk about a slightly easier problem: row recall. Colloquially, many people refer to this as “coverage” and it is simply how many total POIs we cover in a geographic zone. We benchmark against Google. When doing these analyses, row precision is the first step. This means that first we eliminate Unconfirmed, Closed, and Duplicate rows so we can only compare Real Open rows between vendors. This elimination is manual and follows the guidelines outlined in the prior section: broadly we verify via 1) existence of a first party website or 2) recent reviews.
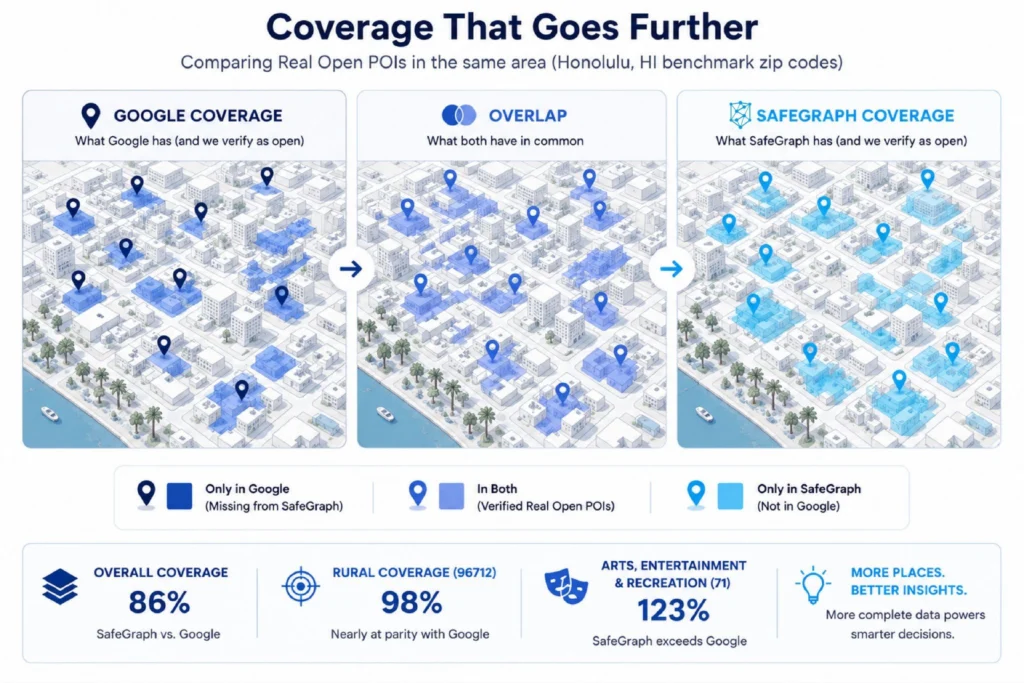
Once we have the Real Open rows for SafeGraph and Google, we manually match the rows. The end result is a number of Real Open POIs each vendor has in a specific zone. For Q2 2026, we benchmarked two Hawaiian zip codes: 96815 (Honolulu – urban) and 96712 (Haleiwa – rural). Overall Coverage Rate came in at 86%, with rural coverage at 98%, nearly at parity with Google in lower-density areas. By NAICS category:
Q2 2026 Coverage Rate by Industry
NAICS Category | Coverage Rate | Real Open Rate |
Arts, Entertainment & Recreation (71) | 123% | 79% |
Other Services (81) | 100% | 71% |
Retail Trade (44–45) | 60% | 63% |
Accommodations & Food Services (72) | 68% | 80% |
A Coverage Rate above 100% means SafeGraph has more verified Real Open POIs in that category than Google does in the sampled area.
Improving recall comes down to adding sources. SafeGraph Places now totals 78,038,621 POIs globally, a net increase of 1,857,172 in the May 2026 release alone. This month’s country standouts include the US (+1.3M POIs), Brazil (+261k), and Italy (+223k). We also added 393 new brands across 133 countries in a single release cycle, including Hoyer (7,939 POIs), Sparkassen-Finanzgruppe (7,078 POIs), and Confortauto (4,277 POIs). For a full look at how our sourcing pipeline works, see SafeGraph’s Data Sourcing Process.
Naturally, there are nuances in deciding if a place is a POI. Should every real estate agent at a firm be its own POI? Each lawyer at a law firm? The ambiguities are endless. We’ve documented our guidelines and these definitions evolve with market needs. Learn more about how our definition of a place has evolved.
Why Does This Matter?
Row precision, row recall, all this detailed and technical work, why bother? The cursory reason is that we are a data company and pride ourselves on selling high veracity data. But more importantly, better SafeGraph data improves our customer’s bottom lines.Better SafeGraph data improves our customers’ bottom lines. For a broader view of what’s possible with accurate POI data, see 5 Common Use Cases for Points of Interest Data Across Industries.
Mapping applications : A higher Real Open Rate means fewer bad arrivals for users of apps like Apple Maps or Mapbox. More coverage means more places surface when users search. A 70% Real Open Rate means 7 in 10 SafeGraph POIs are verified open, and we’re improving that every quarter.
QSR real estate teams : Companies like Subway, Domino’s, and Chipotle use gravity models to estimate foot traffic at future sites, but we all know that in models, Garbage in = garbage out. With 86% coverage versus Google and a 70% Real Open Rate, SafeGraph gives modeling teams a reliable foundation for million-dollar location decisions.
Site selection software : Platforms like Kalibrate, Buxton, or Crexi embed POIs so customers can analyze trade areas. When customers see closed or missing POIs, they doubt the platform. Higher data quality reduces support burden and improves renewals. See how this plays out in The Ultimate Guide to Local Search Applications: POI Data.
OOH advertising and visit attribution : Firms take billions of mobile GPS pings and cluster them into POI visits. Better SafeGraph data means more accurate audiences and improved campaign planning for advertisers, and more revenue for their customers.
POI Data Buyer’s Checklist
Six questions to ask any POI data vendor before you commit.
- What is the Real Open Rate, and can you show it by geography and category?
Ask for the percentage of POIs verified as real and currently operating, broken out by urban vs. rural and by NAICS category. A single blended number hides a lot. SafeGraph’s Q2 2026 Real Open Rate ranges from 63% (Retail Trade) to 80% (Accommodations & Food Services) depending on category. - How is coverage benchmarked, and against what standard?
Vendors should benchmark against a known external reference, ideally Google. Ask for coverage rates broken out by geography and industry. SafeGraph’s Q2 2026 overall coverage is 86%, with Arts & Entertainment exceeding Google at 123%. - How are closed POIs detected and how quickly?
A quality vendor documents their closed-POI detection process. SafeGraph tracks brand store closures monthly, in the March 2026 period, we flagged 1,927 brands with at least one closure and 2,093 with at least one opening. - What are the column fill and precision rates?
Ask what percentage of rows have a given column populated, and what percentage of those values are verified correct. Column precision = fill rate × accuracy rate. A 70% fill rate with 90% accuracy yields only 63% effective column precision. - How many sources feed the dataset, and how often are new ones added?
More sources mean better recall and fresher data. Ask how the vendor handles source conflicts and deduplication. SafeGraph added 393 new brands across 133 countries in a single May 2026 release cycle and grew the global dataset by 1.86 million POIs in one month. Read more about SafeGraph’s data sourcing process. - Can you get a sample before you buy?
Any reputable vendor should provide a representative sample. Test it against your own ground truth before committing. Download a free SafeGraph sample dataset to start your evaluation today.
The Pursuit Continues
Data quality is not a finish line, it’s a discipline. When we started this work, our Real Open Rate was 60% and our coverage sat at 79% of Google’s verified POIs. Today, those numbers are 70% and 86%, with categories like Arts, Entertainment & Recreation already outpacing Google entirely. SafeGraph Places has grown to over 80 million POIs globally, with nearly 1.9 million added in a single month. But the number we care about most is not any single metric, it’s the confidence our customers feel when they make a decision with our data underneath it. Every bad POI we remove is a mapping app that stops sending someone to a closed storefront. Every new source we add is a real estate team that can trust its model. Every percentage point of coverage gained is a campaign that reaches a more accurate audience. We will keep publishing these numbers every quarter, keep narrowing the gaps, and keep being honest about where they still exist. That is the only way to build data worth betting on.