Store visit attribution answers one of the most valuable questions in modern retail and advertising: did a digital ad, a push notification, or a marketing campaign actually bring someone through the door?
It sounds straightforward. But between messy GPS signals, imprecise location boundaries, and the complexity of multi-store environments, accurately attributing a physical store visit to a mobile device is a genuine engineering challenge. Companies that solve it well gain a significant edge in how they plan campaigns, allocate ad spend, and build audiences.
This guide covers what store visit attribution is, why it matters, how the two main methods compare, how accurate attribution works step by step, a real-world case study, and what data you need to get it right.
What Is Store Visit Attribution?
Store visit attribution is the process of using GPS location data from mobile devices, combined with POI data, to determine whether a specific device visited a physical place, a brand location, or a category of store.
At its core, it connects the digital world to the physical one. When a person sees an ad on their phone and later walks into the store that ran that ad, visit attribution is how you close that loop and measure the outcome.
There are two primary attribution methods: using precise building footprint polygons as geofences, or using a centroid radius drawn around a store’s central point. The difference between these two approaches directly determines how accurate your attribution counts are, how many false positives you generate, and whether your audience data is actually useful for downstream decisions.
Why Online-to-Offline Attribution Matters for Retailers and Advertisers
Physical retail is not shrinking. Ecommerce still accounts for only around 16% of total US retail sales, which means the overwhelming majority of revenue is generated in stores. Yet most advertising measurement infrastructure was built for digital-only outcomes.
That gap is exactly what store visit attribution solves. Three specific use cases drive most of the demand:
Build custom audiences with real-world behavioral signals : When you know which devices have visited your locations or a competitor’s, you can create audience segments based on actual purchase-adjacent behavior rather than demographic proxies.
Attribute ad spend to physical outcomes : Without visit attribution, upper-funnel channels like connected TV, digital out-of-home, and display advertising receive no credit for the in-store traffic they generate. Store visits are one of the strongest offline micro-conversions available to advertisers today.
Trigger contextual push notifications at the right moment : Geofencing is only effective when the geographic boundary it uses is accurate. A geofence built on imprecise place data will trigger notifications for people who are near a store but not inside it, or miss people who are standing in it.
Building Footprint Polygons vs. Store Centroids: What Is Actually Different
This is the technical decision with the largest downstream impact on attribution quality.
Store Centroids and Centroid Radii
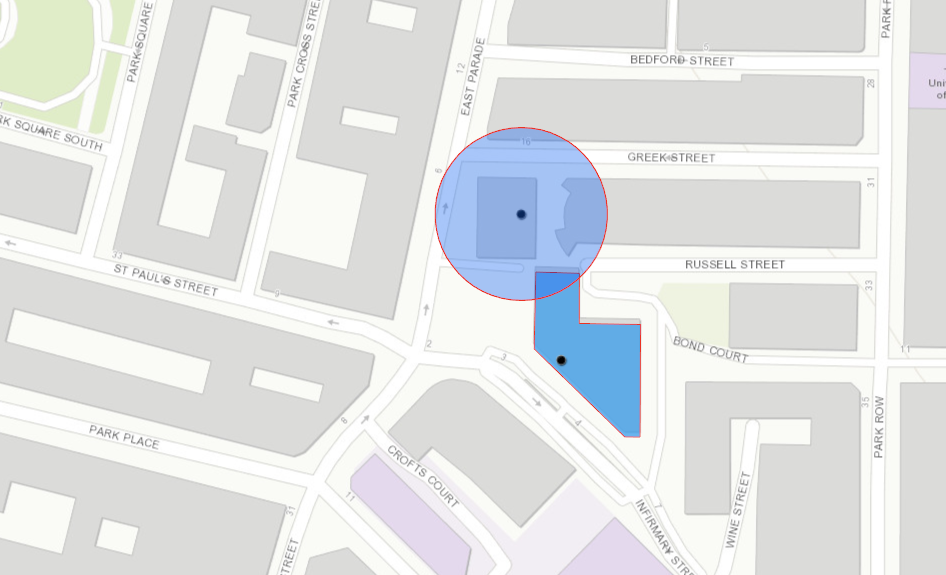
A store centroid is the mathematical center point of a property. A centroid radius draws a circle of fixed distance outward from that center, typically somewhere between 50 and 500 feet.
Centroid-based attribution is easy to implement with any geospatial data point and standard GIS tools. The problem is precision. Very few commercial buildings are circular. A circle drawn around the center of a store will include parts of neighboring businesses, parking areas, and the road in front. If the radius is too conservative, parts of the actual building fall outside the boundary and real visits get missed. The result is a mix of under-counting and over-counting that makes attribution unreliable for any use case requiring precision.
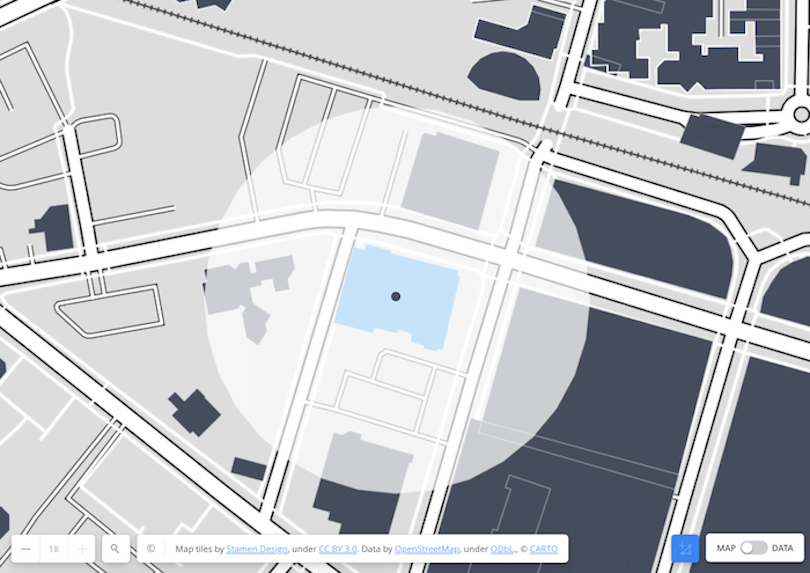
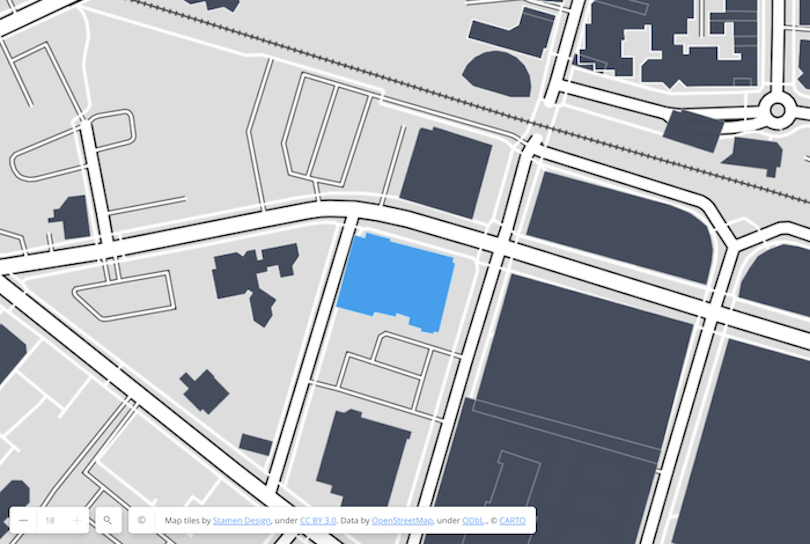
Building Footprint Polygons
A building footprint polygon maps the exact physical outline of a structure, not an approximation. SafeGraph’s Geometry dataset includes these polygons along with spatial hierarchy metadata that captures parent/child relationships between locations, so a store inside a strip mall can be distinguished from the strip mall itself and from neighboring tenants in the same complex.
For visit attribution, this spatial hierarchy is critical. Without it, a GPS ping inside a multi-tenant retail building could be attributed to any of the stores within it. With it, the attribution can resolve to the specific POI the device actually visited.
For any organization where attribution accuracy translates into ad spend efficiency or audience quality, building footprint polygons are the foundation that makes everything else work.
The Accuracy Problem: What Makes Store Visit Attribution Hard
Even with good place data, several technical problems require active handling:
GPS signal noise
A device standing inside a store may register a ping several meters from its actual position due to signal drift or building interference. A device driving past will briefly generate pings near the building. A device parked in an adjacent lot will generate sustained pings nearby. None of these are store visits, and a system without proper filtering will count some of them as such.
Horizontal accuracy variability
The margin of error around a GPS reading fluctuates constantly. A ping with 5-meter accuracy and one with 50-meter accuracy look identical in raw data but carry very different levels of confidence.
Dense retail environments
When two stores are 20 feet apart, the margin of error in a GPS ping may be large enough to place a device in either location. This is especially common in strip malls, urban corridors, and indoor shopping centers.
Device coverage gaps
Not all mobile users have location services enabled. Attribution models are working from a sample of total in-store traffic, not a complete census. The better the underlying POI data, the more confidently the sample can be used to generate representative insights.
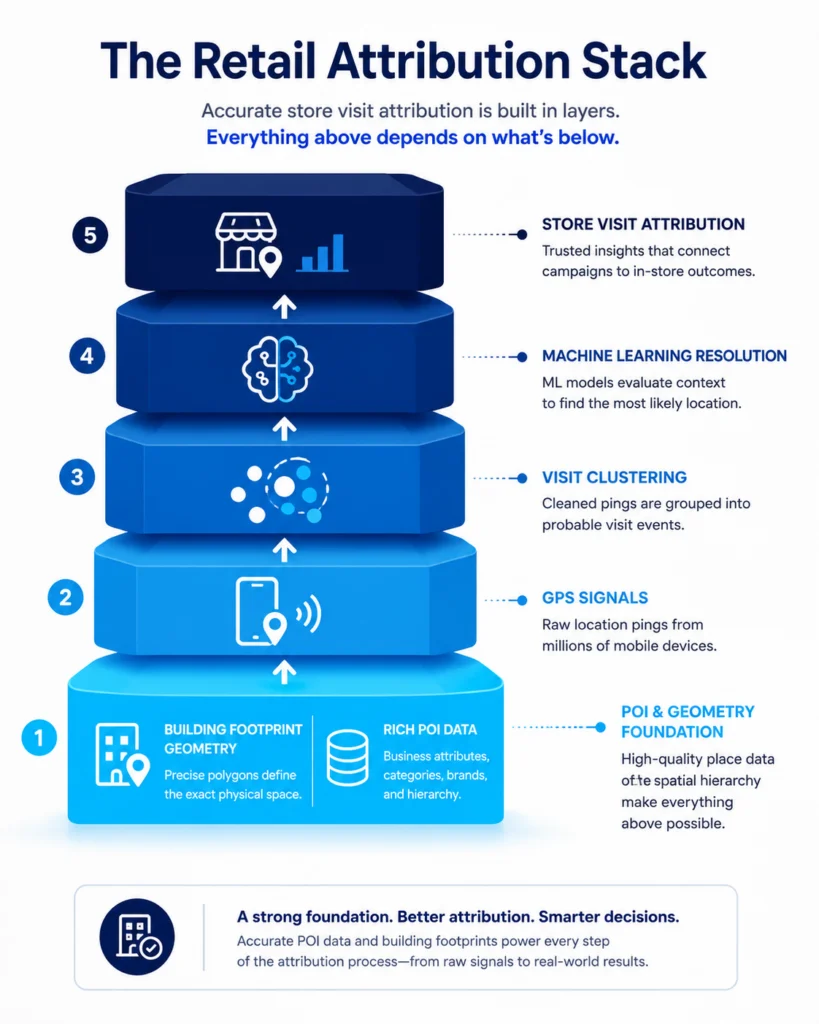
How to Correctly Attribute Store Visits: A 4-Step Method
The following is an outline of SafeGraph’s visit attribution methodology. For the complete technical walkthrough including clustering algorithms and machine learning model design, see the technical whitepaper.
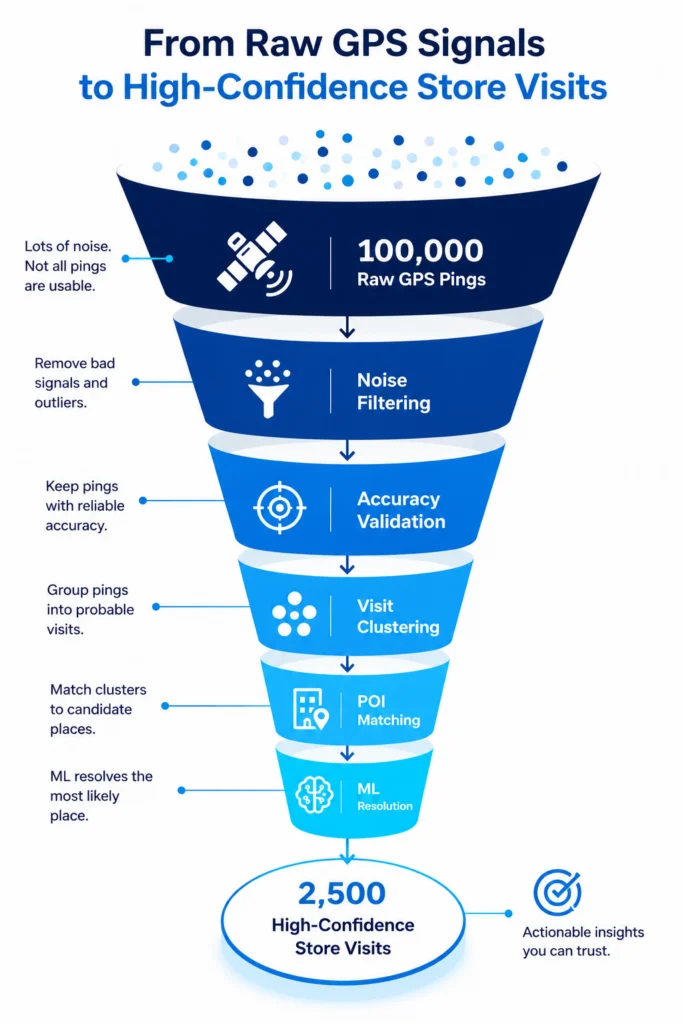
Step 1: Clean the GPS Data
Raw GPS data cannot be used directly for attribution. Signal drift, spiking horizontal accuracy values, and jumpy pings that suggest physically implausible movement all need to be identified and removed before any spatial analysis begins. The cleaning process filters non-stationary pings, removes readings above a calibrated horizontal accuracy threshold, and calculates device speeds between consecutive pings to flag corrupted data.
Step 2: Cluster GPS Pings Together
After cleaning, pings are grouped into candidate visit events without using any POI data to bias the clustering. Two passes are applied: one identifies clusters inside large POI footprints like malls and airports, and a second applies a modified DBSCAN algorithm to remaining pings, grouping together dense readings that suggest the device was stationary in a specific area. What remains are clusters that represent probable location visits.
Step 3: Prepare Clusters and Match to Candidate Places
With clusters identified, a geospatial join is performed between each cluster and the building footprint polygon dataset. A buffer is added around each cluster to account for remaining GPS uncertainty. This produces a set of (cluster, possible places) pairs where each cluster has one or more candidate POIs it may be referencing.
Step 4: Predict the Most Likely Place
In dense environments, a single cluster may overlap with multiple candidate POIs. This is where machine learning resolves the ambiguity. Models evaluate contextual signals, including time-of-day patterns and NAICS category data from SafeGraph Places, to predict the most likely visited location. A cluster at 11 pm next to a coffee shop and a bar almost certainly belongs to the bar. A cluster at 8 am in the same location is more likely the coffee shop. Category and temporal context make these predictions reliable at scale.
Real-World Case Studies: How Companies Use Visit Attribution with SafeGraph Data
Olvin: Building a More Accurate Retail Analytics Platform
Olvin, a predictive retail analytics company, was building its Almanac platform to answer a specific customer need: granular, store-level foot traffic insights. Its original data provider could not deliver. Polygons were misaligned, sometimes placing stores in incorrect locations entirely. Cleaning and importing the data took up to two months before it was usable.
After switching to SafeGraph Places and Geometry data, Olvin ran a simple but rigorous validation test: verify that every store location aligns with its real-world Google Maps position. SafeGraph passed. The accurate building footprint polygons allowed Olvin to build an attribution model that could assess store-level activity with the kind of precision its customers needed for site selection, assortment planning, and labor optimization.
“The ability to offer our customers store-level foot traffic insights has helped us unlock new conversations,” said Matthew Taaffe, Olvin’s VP of Product.
By moving from aggregated local-area data to true store-level attribution, Olvin shifted its offering from summarized foot traffic to predictive, granular intelligence.
Billups: Turning OOH Advertising Into a Performance Channel
Billups, a data-driven outdoor advertising company, used building footprint polygons and anonymized mobile location data to complete the customer journey from ad exposure to in-store visit. This was a fundamental transformation for OOH: an advertising format that had historically struggled to prove performance attribution.
By using precise geofences derived from SafeGraph Geometry data rather than store centroids or geocoded addresses, Billups was able to detect store visits with significantly higher accuracy. The result was the ability to offer OOH as a performance-based medium, with measurable in-store lift that could be compared across campaigns, placements, and creative executions.
Media Storm: Reducing Wasted Ad Spend Through Accurate Location-Based Audiences
Media Storm faced a specific challenge in its attribution workflow: without knowing exactly where stores were located, its audiences included irrelevant mobile advertising IDs (MAIDs), resulting in wasted spend. Centroid-based approximations were not sufficient to separate actual visitors from people in the general vicinity.
Using SafeGraph’s brand information, NAICS codes, and exact building footprints, Media Storm was able to identify precise store locations for clients and competitors alike, then build location-based audiences that reflected actual visits rather than proximity estimates. The improvement in geofence precision translated directly into more accurate attribution and more efficient campaign targeting.
What Data Do You Need to Power Reliable Visit Attribution?
Two datasets are foundational:
POI data provides the structured record of where places are, what they are, and what category they belong to. SafeGraph Places covers millions of global POIs with attributes including address, NAICS category, brand affiliation, and open/close status. For a full breakdown of the schema and available fields, the SafeGraph Places Data Technical Guide is the right starting point.
Geometry (building footprint) data provides the polygon boundaries needed for precise attribution. SafeGraph Geometry includes building footprints along with the spatial hierarchy metadata that captures parent/child location relationships.
For teams evaluating location data providers, the SafeGraph Data Evaluation Checklist offers a structured framework for comparing accuracy, coverage, and freshness across sources. For broader context on how geospatial data types fit together, the geospatial data types guide covers the full landscape.
Closing Thoughts
Store visit attribution has moved from a nice-to-have measurement layer to a core part of how serious retail and advertising teams evaluate campaign performance. As more budget flows into channels that do not produce a trackable online click, such as OOH, CTV, and programmatic display, the ability to tie that spend to a physical in-store visit becomes the difference between measurable ROI and educated guessing.
But attribution is only as credible as the data underneath it. A four-step methodology built on cleaned GPS data and machine learning predictions still fails if the place boundaries it references are circular approximations that bleed into neighboring storefronts. That is why the choice between centroid radii and building footprint polygons is not a technical detail. It is the decision that determines whether your attribution output is reliable enough to act on.
The companies getting this right, whether they are building retail analytics platforms, running performance OOH campaigns, or constructing location-based audience segments, share a common starting point: accurate, fresh POI data with precise geometry. That foundation is what SafeGraph Places and Geometry are built to provide.
If your current attribution workflow is producing inconsistent visit counts, inflated audience overlap, or results that do not hold up under scrutiny, the place to start is the place data itself.
Schedule a demo to see how SafeGraph data fits into your attribution pipeline, or explore the technical whitepaper for the full methodology.