Property risk profiles are increasingly data-driven. With the abundance of data available, insurers are able to develop more accurate property risk models than ever before. Critical elements to risk modeling, like environmental characteristics, proximity to other structures, and historical risk events, all contribute to a property’s insurance profile. But to stay competitive in an increasingly saturated insurance market, insurers must constantly improve their risk models and policy pricing to be as accurate and precise as possible. To give them an edge, industry leaders are turning to places data.
Places data – like points of interest (POIs) and building footprint – is fundamental to insurance risk modeling for a few reasons. In this blog post, we break down what insurers need to know in today’s competitive market.
Ready to dive into data-driven insurance risk assessment? Check out our notebook for measuring co-tenant risk.
Pinpointing the Property
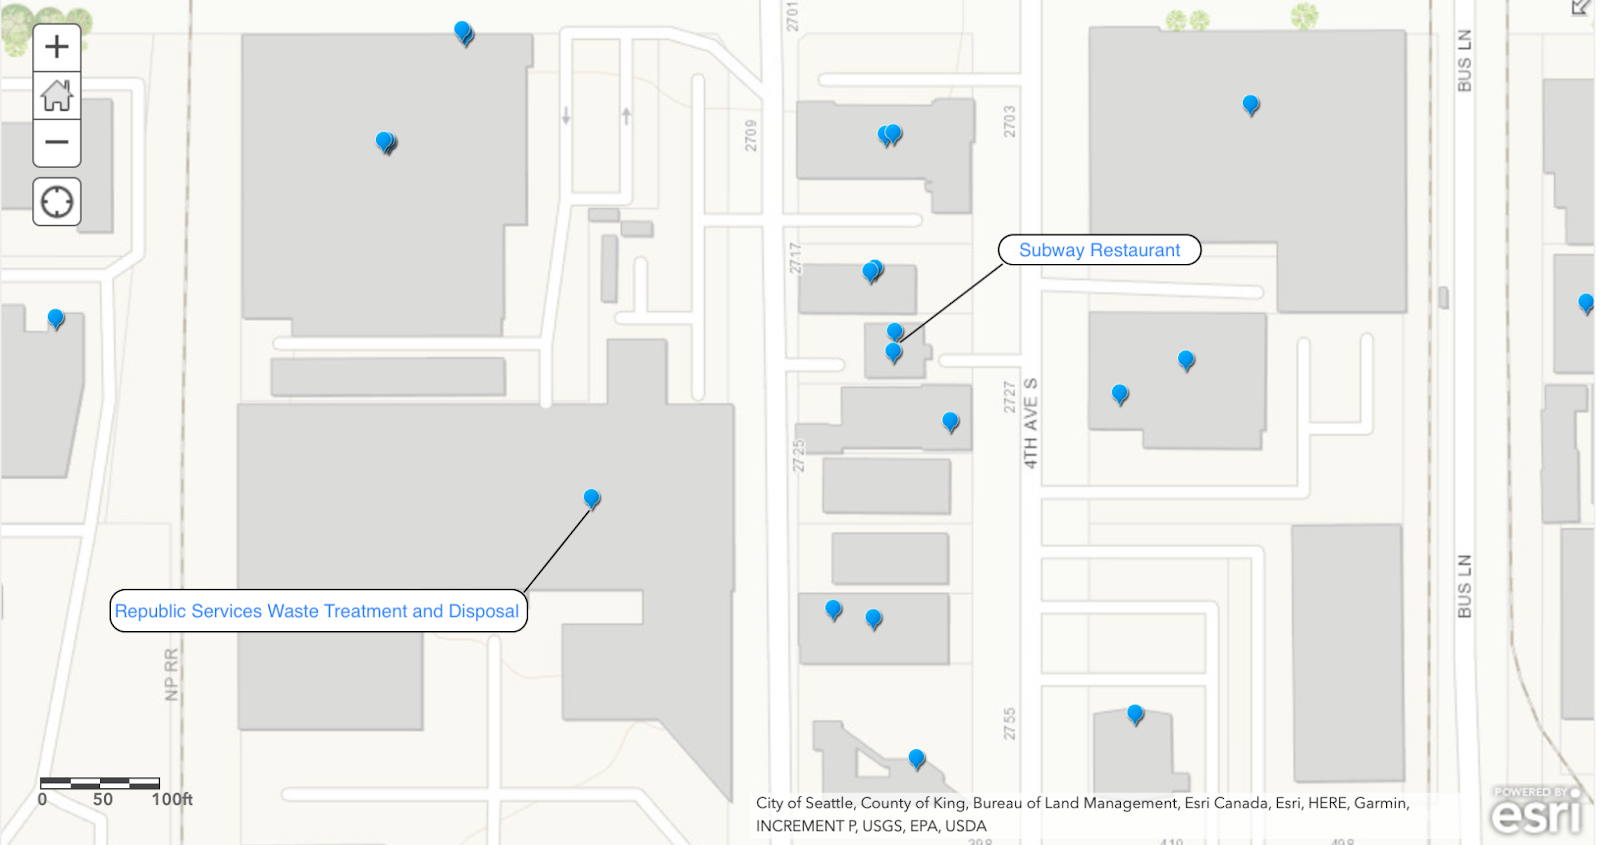
POI data provides a source of truth for a property’s location. An accurate and precise data point for a property’s physical location is essential for measuring the environmental (like flood or wildfire risk) and commercial (such as the type of business being conducted at that location) factors that may impact its insurance profile. But POI data is also crucial for conducting proximity analysis to identify nearby places that may pose additional risk to a property. SafeGraph Places data includes the geographic location and business detail attribution required to fully analyze a particular property.
Measuring Proximity and Co-Tenancy
Building footprints are a key part of insurance risk modeling. While using POI data to see where a property is, truly understanding its location and what is nearby requires accurate polygonal representation of that property’s structure. When looking only at point data, a property may appear to be outside of a flood zone. However, when analyzing that POI’s geometry, you may discover that in reality a part of the building extends into the zone. Similarly, a shoe store may appear to be located in a regular shopping center, but actually share a wall with a fireworks store next door. These discoveries will impact insurance risk models and policy pricing for those properties.
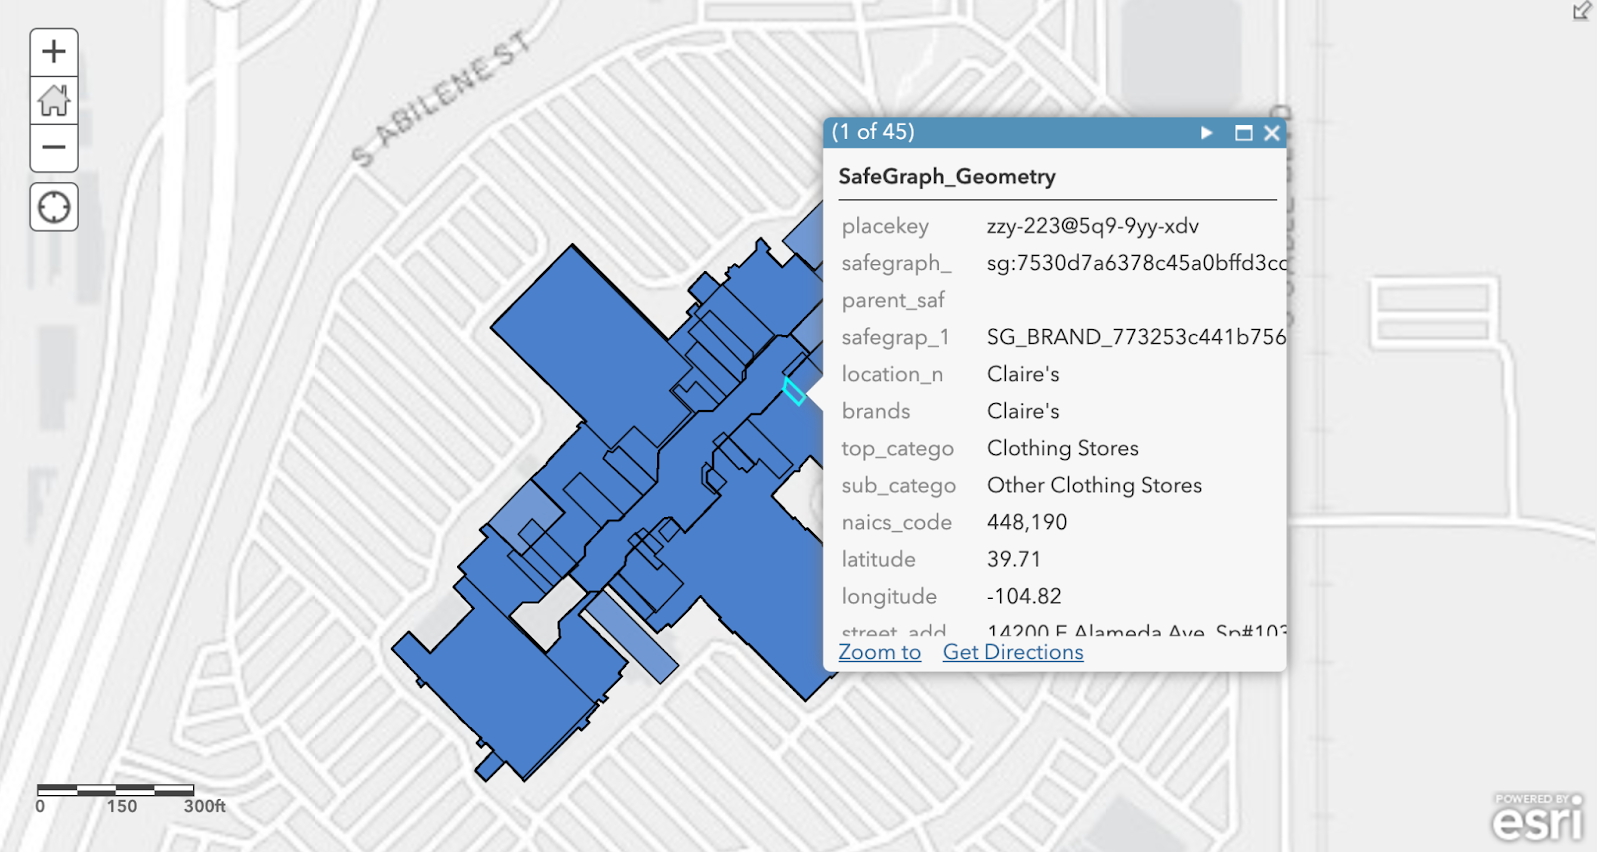
For non-residential properties in particular, accurate and precise building footprints can make the difference between an effective risk model and one that actually hurts the insurer. With an abundance of malls, office complexes, and shopping centers, co-tenancy analysis is quickly becoming one of the most critical components of insurance risk modeling.
Co-tenancy analysis enables insurers and risk modelers to see which businesses are located within the same parent polygon. SafeGraph Geometry data provides parent and child POI polygons, along with attribution for identifying the spatial relationship between them. The polygon_class and enclosed fields simplify this process, making it easy to understand the spatial hierarchy of multiple POIs.
Precision, Accuracy, and Transparency
SafeGraph’s sole focus is data. That means we do not build analytics or reporting tools. Instead we focus on curating and delivering high-precision facts about the world so our customers can make informed decisions based on accurate information.
Our rigorous machine learning processes make us expert de-dupers so data is delivered clean and accurate for insurers to ingest into their risk models. With monthly updates, our data is a source of truth for physical places that insurers can rely on. Frequently updated places data prevents risk models from becoming outdated and inaccurate, which is especially important in today’s pandemic when many businesses are moving or closing at unprecedented rates.
But SafeGraph’s main differentiator is our transparency. We communicate everything – even our faults – with our customers. Our technical docs site is always up-to-date and open to provide the public with schemas and statistics for our datasets. Every month, we publish our release notes that openly communicate any bugs and our plans for fixing them. Even within the data itself, we indicate how we created a particular record, so you can decide how to factor that into your models.
Reliable data for risk modeling is critical for insurers looking to move faster without sacrificing accuracy and precision. Under- or over-priced policies can damage an insurer, either by opening them up to potential financial loss or pushing their customers towards the competition. But with SafeGraph Places data, insurance risk models can accurately and precisely measure how locations impact a property’s risk exposure, so policies can be priced accordingly.