
In today’s ever-evolving physical world, accurate and timely points of interest (POI) data proves more important than ever. Businesses, organizations, and research institutions gather and utilize POI data to execute successful operations - from food delivery services to find-my-nearest apps to marketing and advertising campaigns. However, POI-based applications rely on up-to-date information to provide genuine value to a product or service, and many POI resources fail to deliver adequate or accurate location data due to the dynamic nature of our world.
A key concern of using POI data for business applications is data validation. While many POI data resources use semi-reliable data validation approaches (think manual verification and directory checks), many fail to maintain timely validation methods. In fact, most POI data providers only update their databases every three to six months, which can be problematic depending on the data’s application. For example, when evaluating another POI data provider’s free match service in February of 2022, we found that 17% of their POI records were invalid. We confirmed this by checking website domains and searching for news articles about store locations that recently closed or relocated.
“We can’t be on the ground in every local market we operate in—we need access to data that can be our ‘eyes’ on the ground and give us a more accurate idea of what the local market looks like. But it wasn’t a good use of the team’s time to append partially complete POI data with open-source data to fill in the gaps.” - Julian Adams, Director of Data Science at Avison Young
According to the National Retail Federation, more than 8,100 retail store locations opened in 2021 - and that’s just in the US. Whether these were new brand openings, brand expansions, or store relocations, this stat indicates just how much POIs change every day. At a global scale, these changes are challenging to stay ahead of, and many companies building mapping and location-based platforms or applications struggle to curate an accurate and up-to-date database of places.
When POI data is an integral part of an organization’s operations, the risk associated with such a significant gap in database updates is high. A company that relies on an up-to-date record of places for its trade area analysis, for example, risks building catchments based off of incorrect competitor locations, thus misallocating resources if using stale data. Similarly, a consumer-facing mapping application built with outdated POI data makes for a poor user experience and creates a high churn rate. These are just two examples among many of the importance of data veracity when representing the dynamic physical world.
Working with stale and inaccurate data is also highly inefficient. According to research by Gartner, poor data quality costs large corporations nearly $15 million per year in losses, both in time and resources. Modern data scientists spend approximately 19% of their time collecting baseline data and 60% of their time cleaning and organizing it. With the majority of time spent remediating ‘dirty data,’ companies can drastically reduce operational data costs by simply obtaining high-quality data from the start.
"We pored through spreadsheets to isolate categories and look for issues in the data and SafeGraph was the clear winner. There was just so much weird, junky stuff in the other datasets, it just didn't pass basic data quality. So kudos to you guys for a solid product." - Nic, Babb, VP of Engineering at Adomni
This need for fresh and reliable POI data is why SafeGraph was founded in 2016, and we remain focused on one thing only: being the source of truth for physical places. The SafeGraph Places dataset is curated each month to empower organizations with an up-to-date view of global market landscapes, brand relationships, and how places share physical spaces.
SafeGraph Places is a comprehensive dataset composed of high-quality POIs, leveraged by thousands of organizations globally who trust the data as their primary source of truth. It’s a database created to address the most pressing challenges involved with POI data collection and upkeep, providing data scientists, product managers, and analysts with accurate and timely location information to ensure their products, services, analytics, and strategies are built on real-world facts. Places contains a robust set of geospatial attributes to provide deep context about physical locations, including address string, geographic coordinates, brand affiliation, open/close date, and NAICS/category codes.
An advantage of SafeGraph’s Places dataset is the breadth of location types included. While many POI providers only provide traditional commercial places, such as restaurants and retail stores, SafeGraph additionally curates POI data for parks, warehouses, EV charging stations, oil rigs, and other important, non-traditional places. This comprehensive coverage of global places under one unified data schema enables efficient data ingestion, modeling, and analysis - eliminating the need to prep data from multiple sources.
SafeGraph’s data curation process ensures the POIs included in Places are geographically precise and contain fresh and accurate attributes about what is actually occurring at that place. In the next section, we’ll dive into our data curation methodology and how we maintain freshness in a changing world.
Each month, SafeGraph creates the Places dataset using machine learning (ML) technology, web crawling, and third-party licensing. More specifically, SafeGraph curates POIs by:
The combination of all these sources results in a ready-to-use, clean, and current dataset that reflects the current state of POIs around the world.
“With other data providers, we would have to spend a lot of time cleaning the data to make it useable. Of course, the quality of the data was important to us, but the ethics of SafeGraph’s methodology really stood out.” - Scott Stoltzman, Director of Data Science at RCLCO
Each column in the Places data schema is designed to provide relevant and up-to-date information about global POIs. We describe each column in more detail below:
SafeGraph is a founding member of Placekey, the universal standard unique identifier for places. Placekey was developed out of a need to make location datasets from different sources easily joinable. To make sure our data is interoperable with other location data, SafeGraph appends Placekeys and parent Placekeys to all of our datasets.
Within SafeGraph Places, the Placekey and parent Placekey columns help identify the physical location of a POI and how it is spatially related to other places. When both components of a Placekey come together, it results in the ‘what’ and the ‘where’ of a specific POI and serves as a join-key to simplify bringing multiple location-based datasets together.
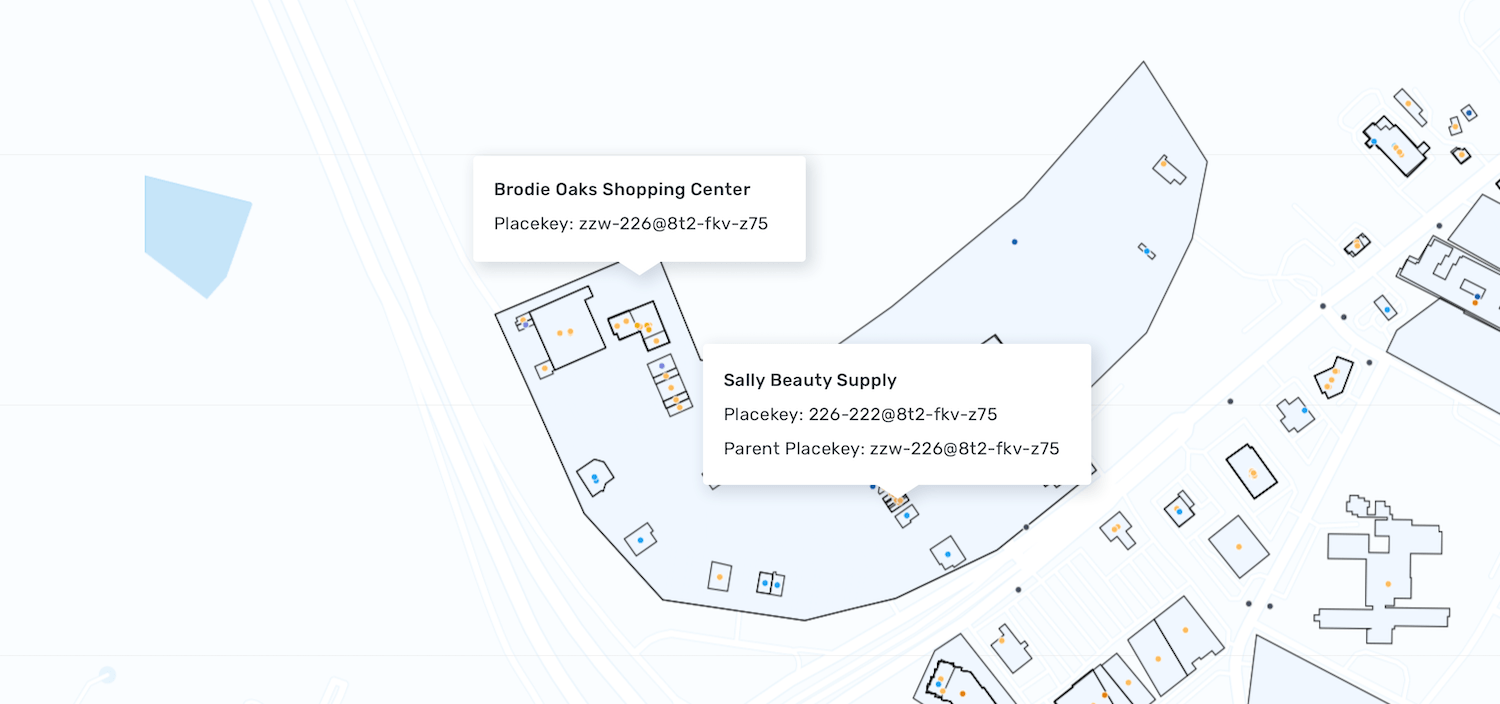
Placekey is a unique and persistent ID tied to an individual POI that simplifies joining location-based datasets from multiple sources. Think of a Starbucks location inside of a shopping mall - that Starbucks will have a unique Placekey because of its geographic location and the type of place it is. Each record in the Places dataset contains a Placekey.
The parent Placekey column, on the other hand, is only populated in rows representing places that are contained by another place. Using the previous example, the Starbucks store inside the mall will have both a Placekey and a parent Placekey, where the Placekey represents the store itself, and the parent Placekey represents the entire shopping mall. This concept of representing how places are related to each other physically is what we call ‘spatial hierarchy.’ Spatial hierarchy metadata appended to SafeGraph Places indicates when a place is standalone, exists within a larger structure, or shares a physical location with another place.
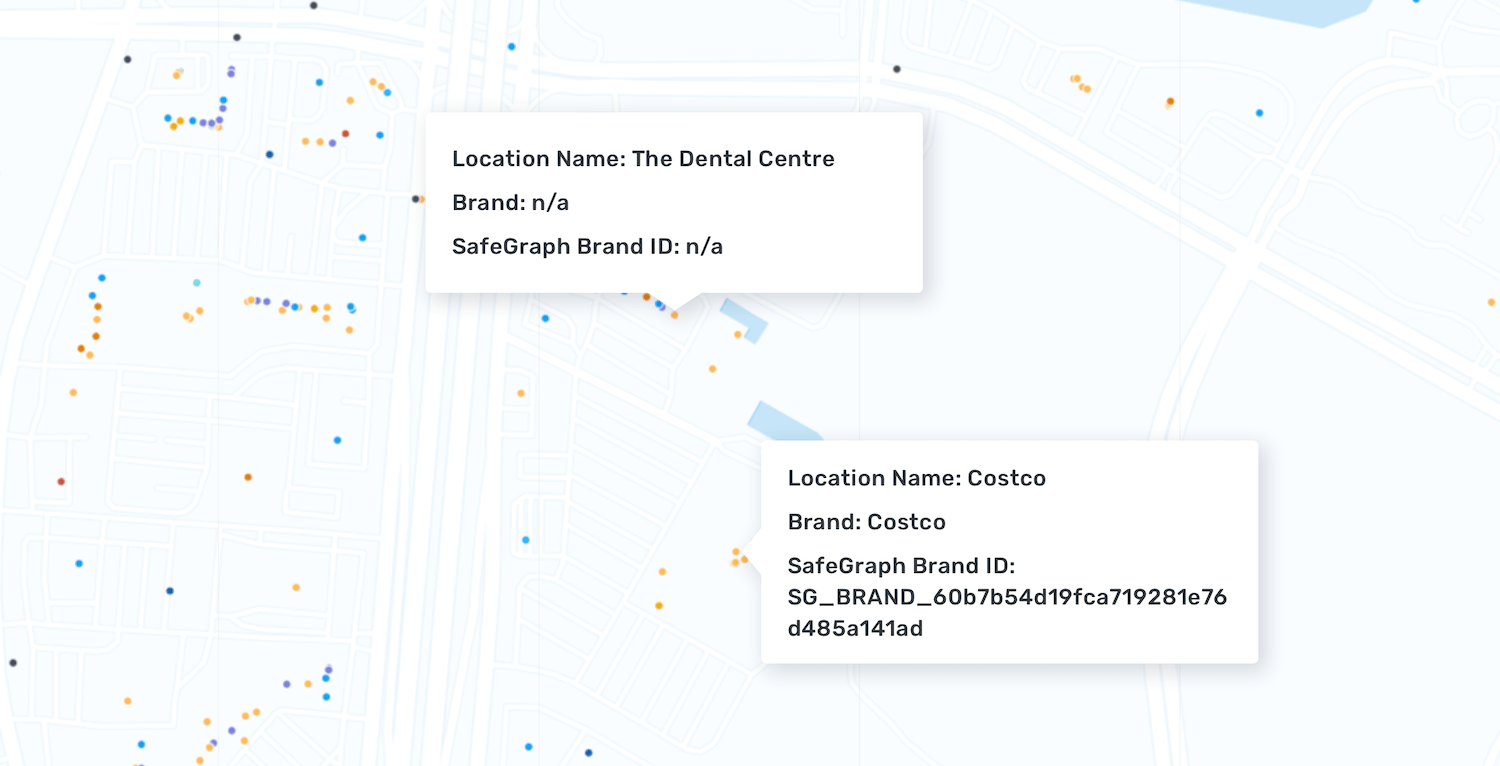
To provide the base information about what exists at each geographic location, SafeGraph includes three closely related columns. The location name column delivers the unique name of each place, such as 7-Eleven. Sometimes this matches the value in the brands column, particularly when a location name is simple, like Walmart, and falls under the Walmart brand. However the location name column can differentiate between a Walmart and a Walmart Supercenter, while the brand for that location will still be just Walmart.
The brands field is helpful for seeing entire brand footprints regardless of whether individual locations have different naming conventions. SafeGraph brand IDs also help surface brand relationships by serving as a unique and persistent identifier for different brands. Brand IDs remain the same in the event of a brand renaming itself so as not to break any existing models or queries.
SafeGraph brand IDs also detail parent and child brands. Similar to Placekey denoting spatial hierarchy, SafeGraph brand IDs show brand hierarchies. For example, Yum! Brands owns multiple restaurant brands, so POIs for those restaurant brand locations will contain a brand ID for that restaurant, and a parent brand ID for Yum! Brands. This takes identifying brand footprints and market landscapes a step further to show how some brands are related to each other, and provides another field option for querying and modeling places data.
Every POI in SafeGraph Places includes a location name, but not all records include a brand or brand ID. This is because many places do not belong to a larger brand, such as independent restaurants or local museums. SafeGraph defines a brand as a branded store which has multiple locations all under the same logo or store banner.
While location name, brands, and brand IDs are included in the main file delivered for SafeGraph Places, we include a supplementary brand info file in each delivery to provide the parent brand ID and more brand-specific information. The brand info file is easily joinable to SafeGraph Places through the brand ID column, and includes brand categorization information, stock symbol, stock exchange presence, and lists of which countries the brand currently has opened and closed locations in.
"From the beginning of our data sourcing process, SafeGraph provided the most comprehensive and actionable POI dataset. Their coverage of the top 1,000 restaurants is unmatched and invaluable.” - Ben Anderson, Senior Manager of Market, Customer, and Competitive Intelligence at Sysco
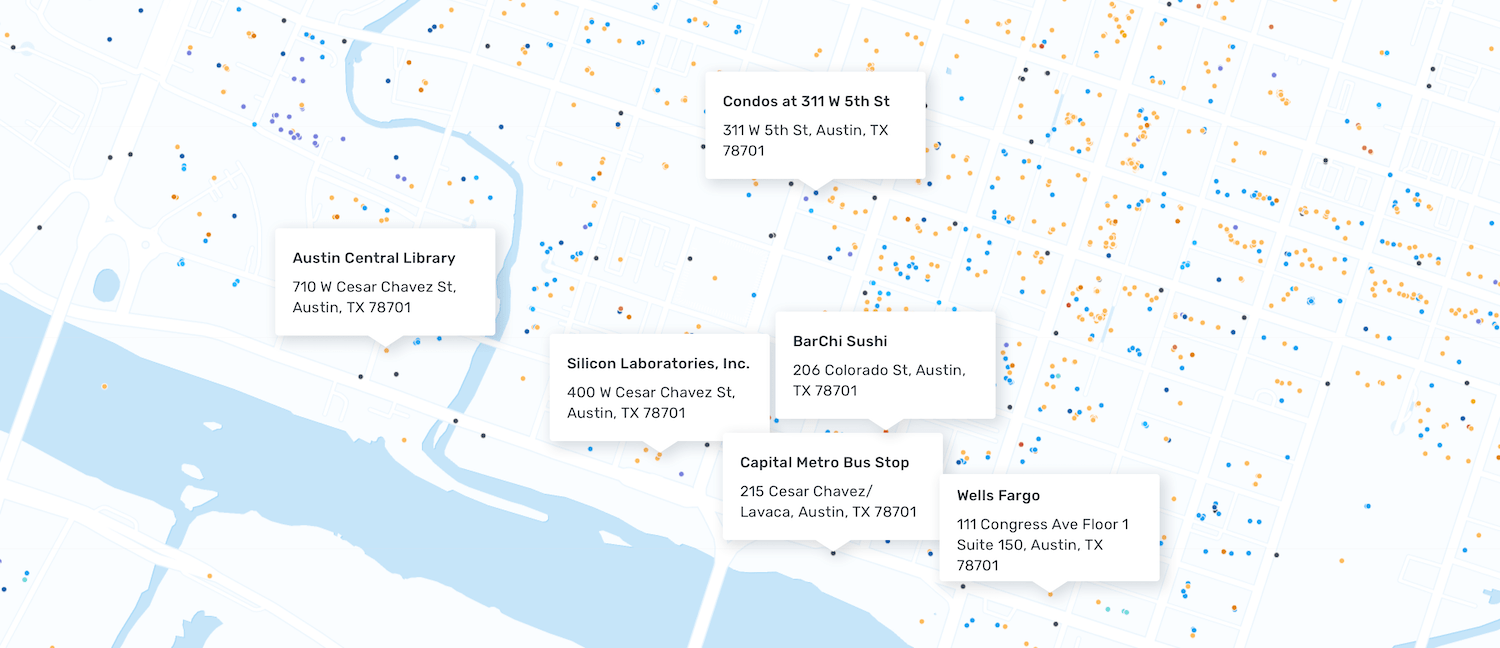
The Places dataset includes separate columns for the latitude and longitude of each POI to make the data easily mappable. It also has columns for parsed-out address strings, including separate columns for street address, city, region, postal code, and ISO country code. These foundational columns not only locate the POIs in the physical world (as does Placekey) but also power geocoding services in mapping applications and serve as valuable filters for selecting POIs from specific geographic areas.
Store IDs are unique identifiers within a brand for store locations. The store ID column enables users to easily join with other datasets that include store IDs. Most often, this involves transaction information, financial statements, quarterly reports, and first-party company data.
To provide further foundational context for each POI, the Places dataset includes three columns related to how people can engage with that place: phone number, website, and open hours. These are particularly useful for mapping applications or platforms that surface information to people looking to interact with a place. The open hours column contains specific hours of operation by day in an easily explorable JSON format.
The NAICS code, top category, and sub category columns categorize a POI by what type of place it is. These categorizations were developed by the US Census Bureau to distinguish different place types and are all closely related to each other.
“SafeGraph data adheres to industry standards, like NAICS codes. This makes it a lot easier for us to work with and join to other data sources without having to do a big cleanup effort.” - Matt Taaffe, VP of Product at Olvin
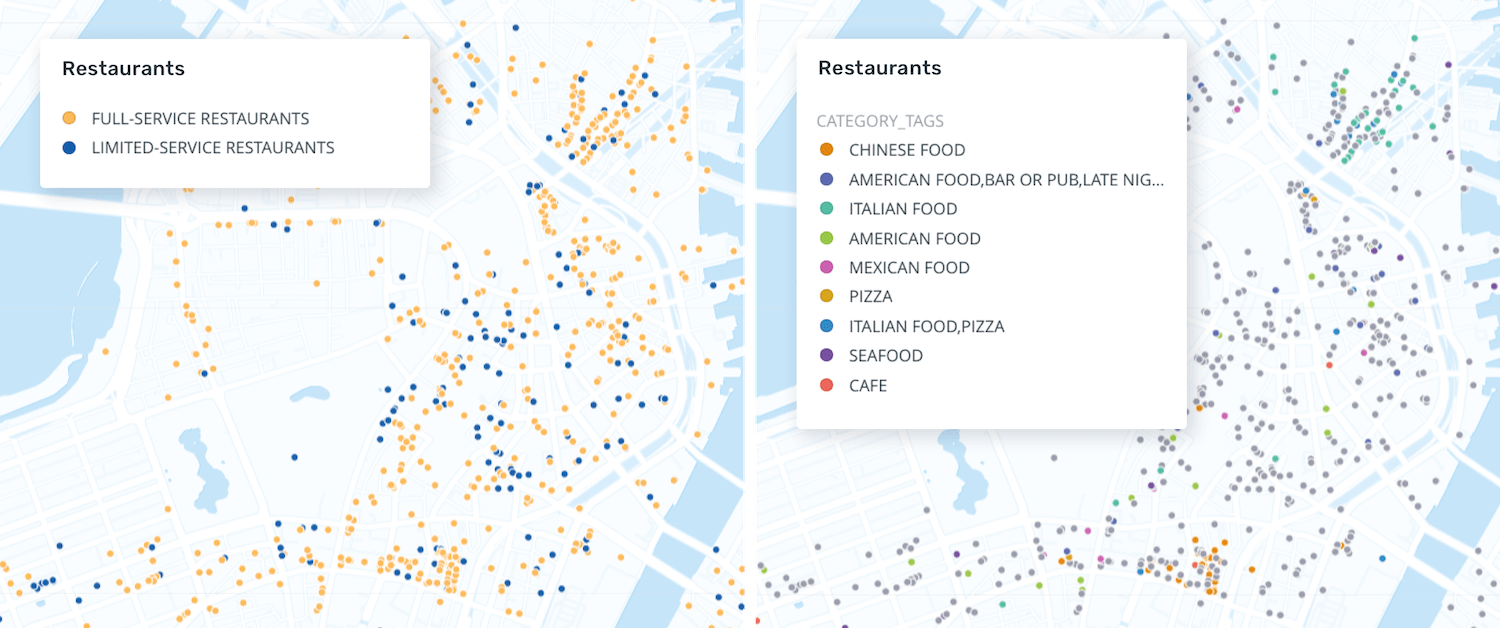
NAICS codes define a POI by a 6-digit code - a taxonomy developed to classify each type of POI numerically. Burger King, a ‘limited-service restaurant,’ contains a NAICS code of 722513. Top category is a string label that defines a POI by its purpose - based on the first 4 digits of a NAICS code. A Burger King, for example, is labeled ‘restaurants and other eating places.’ Sub category is a string label that defines a POI with a description of its purpose - based on the first 6 digits of a NAICS code. The same Burger King location labeled ‘restaurants and other eating places’ in the top category column is labeled ‘limited-service restaurant’ in the sub category column.
SafeGraph strives to provide 6-digit NAICS codes for most POIs, but for some places our models cannot meaningfully differentiate between two adjacent 6-digit NAICS. In these situations we err on the side of caution so as not to provide false facts, and choose to only assign a 3 or 4 digit description, meaning the sub category column will be null.
The category tag column expands on this categorization, providing further flexibility and granularity where the NAICS codes fall short. For example, category tags for a fast food restaurant may include terms like ‘counter service,’ ‘sandwich shop,’ ‘late-night,’ ‘drive-through,’ and more, while the sub category would remain ‘limited-service restaurant’ regardless of the type of food served. Category tags are also helpful in distinguishing between different types of medical offices or retailers. This information is typically used to:
Because each POI can contain multiple category tags, category tags are included as JSON in one column if applicable to a specific place.
To indicate the real-world status of a POI and make it clear when places open and close, SafeGraph includes three date-related columns. The opened on column provides the month and year that POI opened, while the closed on column details the month and year that POI closed, if applicable. If a closed on column value is null, that indicates the POI is still open. If an opened on column value is null, it means we are still acquiring the metadata to confidently report when that place opened, or that it opened before we had rich enough metadata to infer a date. We also include a tracking closed since column to note when we began reporting on that place’s opened or closed status.
The SafeGraph product and engineering teams have developed a detailed and thorough logic for determining if POIs are opened or closed. If a new place from an existing source repeatedly appears in our build pipeline, it is flagged as opened during the month in which it first appears. Similarly, if a POI from an existing source repeatedly disappears from our build pipeline, it is flagged as closed during the month in which it first disappears. These flags are added to the Places product permitting final QA checks and overall data hygiene. SafeGraph does not track temporary closures so as not to mistakenly mark places as permanently closed. You can read more about our open and close logic here.
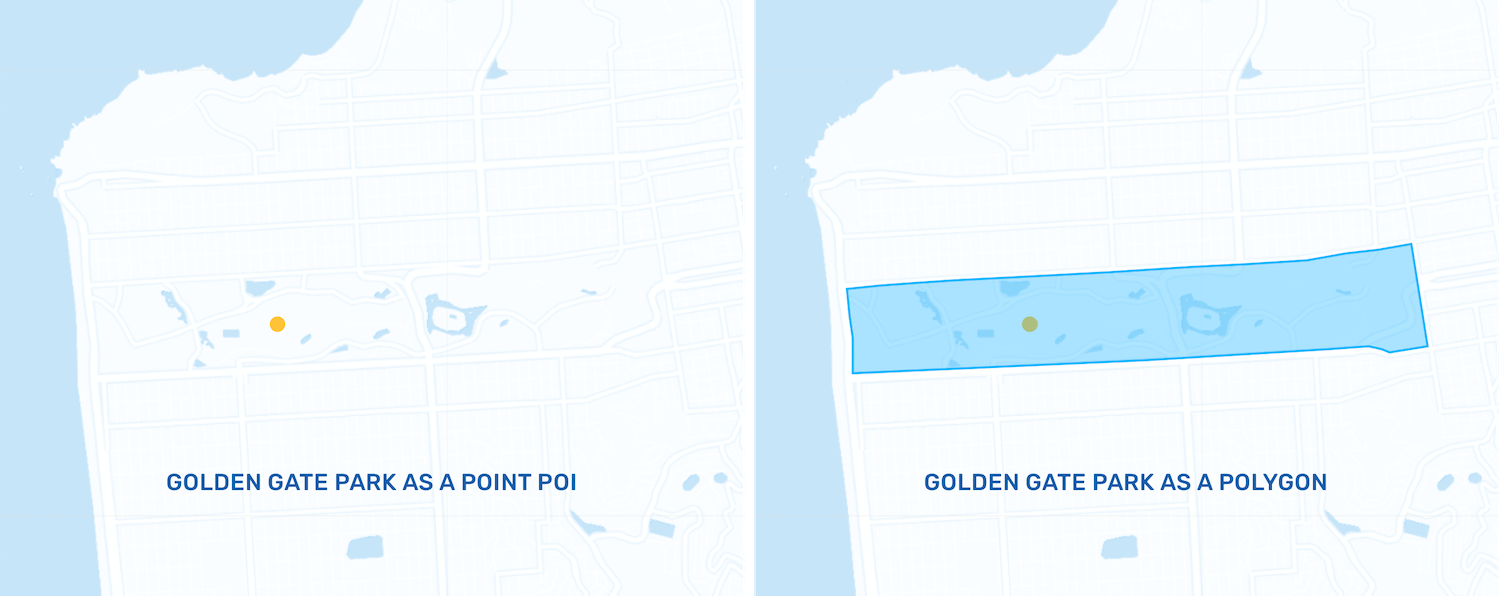
While SafeGraph Places is ultimately a file of latitude and longitude coordinates for POIs, we do provide detail on whether the location itself exists in the real world as a polygonal space or not. For example, while the record for Golden Gate Park in SafeGraph Places is represented as geospatial coordinates for a single point, the geometry type field indicates that the park actually can be represented as a polygon. Types of places that do not have a polygonal geometry type include bus stops or ATMs, since they often do not have physical extents large enough for a person to traverse. SafeGraph uses the Places dataset to build Geometry data, providing the polygon data for places with geometry.
Because Places data is comprehensive of all global locations except single-family homes, there are endless ways to leverage it. However, we’ve seen a few key use cases emerge time and again that we’ll explore a bit more to highlight the versatility and applicability of POI data.
“SafeGraph data allowed us to simplify the user experience and make it a whole lot easier for our customers to take action on the insights we provide.” - Ella Walters, VP of AI at Olvin
As with any geospatial dataset, a primary use case for POI data is mapping to communicate and analyze spatial relationships. POIs bring context to any map, whether as part of a base map or as the main feature being displayed. But SafeGraph Places powers more than just map display, and is often the data behind common geospatial workflows such as map search, routing, and geocoding. With an accurate representation of where places are, consumers can locate the nearest bus stop, businesses can identify their closest competitors, and governments can understand who has access to public amenities.
Mapping is an everyday use case for SafeGraph Places across the board, whether to power a business intelligence tool, consumer-facing application, or internal company analytics. Places is frequently an ingredient in the recipe of a larger solution, providing the necessary location context for a variety of purposes. Combined with other datasets, such as demographic, financial, or even first-party data, Places can paint a full picture for end users so they can glean the insights they need effectively and efficiently.
SafeGraph Case Study (Avison Young): Learn more about how Avison Young embeds SafeGraph Places into its map-based real estate platform, expediting a site research process that used to require analysts to spend 40% of their time cleaning bad data.
Retail strategy often comes down to location. Whether trade area analysis, site selection, competitive intelligence, or consumer insights, most strategic analytics in retail involve places. The most advanced retail analytics tools include POI data so users can perform these analytics, but the successful ones ensure quality results with accurate datasets.
Brands use SafeGraph Places data within analytics workflows to attract high-value customers by opening stores in optimal locations, at the right times, and with the best operational decisions - all based on repeatable, timely, and accurate data insights otherwise undiscoverable. POI data provides a detailed look at an industry’s competitive landscape and potential customers based on location, allowing users to choose a store site with the most potential for a positive ROI and develop effective marketing campaigns to reach target customers. These insights take away many of the stresses and insecurities of operating retail locations - allowing teams to rest easy about their decisions and focus on other essential aspects of the business.
SafeGraph Case Study (Dosh): See how Dosh leverages SafeGraph data to reduce time-to-revenue and more quickly onboard new retailers to their platform.
Much like retail, success in advertising is often based on location. The most effective ads reach the right person, at the right time, and at the right place. Firms drastically improve location-based marketing activities by segmenting audiences and building campaigns using real-world insights for related places. Visit attribution models used to determine when a person is at or near a specific place require detailed information about locations so as to then associate the appropriate ads to that location. Without a foundation of POIs, mobile GPS pings lack context and are difficult to take action on. But if those POIs are inaccurate, even by just a few feet, ads can be deployed to the wrong location, resulting in wasted spend and irritated consumers receiving irrelevant messages.
SafeGraph Places provides this context for media and adtech companies to ensure they are optimizing their clients’ ad spend and building the most successful campaigns. The up-to-date details about each POI enable ads to be targeted to the most relevant locations, while the accurate and precise geospatial coordinates prevent over- or underestimating the related area. SafeGraph uses the Places dataset to build our Geometry data, which provides place footprints often employed as geofences by location-based marketing or adtech firms.
SafeGraph Case Study (Billups): Read about Billup’s ability to recommend ideal outdoor media spaces to their clients using SafeGraph data.
With so many variables in the reliability of a POI dataset, curating the best places data is not easy. Most providers focus on one of the following aspects: having the most coverage, updating the most frequently, providing the most precision, or similar. Many POI data providers build their places data as one part of their business, but also spend time developing an accompanying visualization platform or analytics services. These competing priorities make it difficult to devote the time and resources required to be a true source of truth for a physical world that is constantly changing.
At SafeGraph, our sole focus is curating POI data. We do not provide a platform, visualization tool, or professional services, and instead spend our time entirely on sourcing, cleaning, and delivering the most accurate representation of places around the globe. That’s why SafeGraph Places data consistently outperforms the competition when comparing quality and reliability. Our rigorous data sourcing and machine learning methodology, as well as our commitment to democratizing access to data, means SafeGraph Places is trustworthy and readily available to those who need it.
"The documentation and transparency around what makes up SafeGraph’s datasets are what really stood out to us. Not to mention, it was clear that there was a lot of commitment on SafeGraph’s side to make this partnership work.” - Rodrigo Sarmiento Peréz, Co-Founder and Chief Data Scientist at Descifra
Our laser focus on places data curation means we can move quickly and still produce high-quality data. From July 2021 to July 2022, we grew our POI database by over 254% to meet the evolving needs of POI data users. If one of our customers voices a need for a type of places data we do not yet have, we partner with them to source it and deliver it at the level of quality they have come to expect from SafeGraph. This approach has allowed us to rapidly grow our database to include increasingly in-demand places while furthering our mission of being the source of truth for physical places data.
SafeGraph’s mission is to make the highest quality POI data available to those who need it. That’s why we’ve developed multiple data access methods for Places. Large quantities of Places data can be delivered directly to users via multiple data sharing methods, including AWS S3 buckets, Snowflake, and more. Read about bulk delivery options here.
SafeGraph data is always an ingredient in larger solutions, so we are proud to partner with leading data visualization, storage, and analytics platforms to make reliable POI data easily accessible. Explore our data integration partners to see how you can get SafeGraph data directly in your CARTO, Snowflake, Esri, or Databricks instance.
Our physical world is changing faster than ever before, and maintaining timely and accurate data records for POIs is becoming more complex by the day. New challenges won’t be solved with old solutions. Instead, companies and organizations need cutting-edge technologies and trusted data partners to build high-quality products and make the best operational decisions for the success of their business.
To learn more about how SafeGraph Places data can optimize your operations and provide insight to increase ROI, maximize operational efficiency, and build a reputation that exceeds your competitors - visit us at safegraph.com and schedule a demo.