Most data tell you what happened.
Spatial analysis tells you where it happened and why that location matters.
From how cities grow to how businesses expand, many real-world decisions are shaped by geography. Spatial analysis helps uncover those patterns by examining data through the lens of location, distance, and spatial relationships. As the world continues to evolve with advances in technology and the rise of big data, spatial analysis has become foundational to modern analytics and decision-making.
In this guide, we will explore what spatial analysis is, its importance, and how it fits into real-world decision-making.
What is Spatial Analysis?
Spatial analysis is the practice of analyzing location-based data that has a geographic component in order to identify patterns, relationships, and trends tied to location.
Rather than treating data points as isolated values, spatial analysis considers how those points relate to one another in physical space. Location, proximity, boundaries, and movements all become part of the analysis.
In simple terms, spatial analysis answers questions such as:
How do behavioral patterns vary across regions?
What role does location play in business performance and demand-supply relationships?
Why do similar outcomes cluster in certain areas only?
By adding geographic context, spatial analysis turns raw data into actionable insights for better decision-making grounded in the real world.
Why Spatial Analysis matters today
Location has always influenced outcomes but what has changed today, is the scale and availability of location-based data. Global businesses now operate across multiple regions, markets shift faster, and consumer behaviour varies widely even within the same city. Traditional analysis often smooths over these differences. Spatial analysis makes them visible.
Today retail teams want to understand why performance differs across regions. Commercial real estate analysts need to assess how neighborhood dynamics affect site visibility. Marketing and media teams look to measure how audiences move through physical spaces, not just how they behave online. In each case, location is a core variable.
This is where spatial analysis becomes essential. By combining geographic context with behavioral and market data, spatial analysis helps organizations move beyond surface-level metrics towards location-aware insights. Instead of asking what happened, teams can understand where it happened and why that place matters.
As location intelligence becomes more central to modern analytics, spatial analysis plays a key role in supporting data-driven decisions. It enables organizations to identify regional patterns, compare markets more accurately, and respond to changes in the physical world with greater confidence.
For industries that operate across locations, spatial analysis is no longer a niche capability. It is a practical tool for understanding real-world dynamics and making informed decisions at scale.
How Does Spatial Analysis Work?
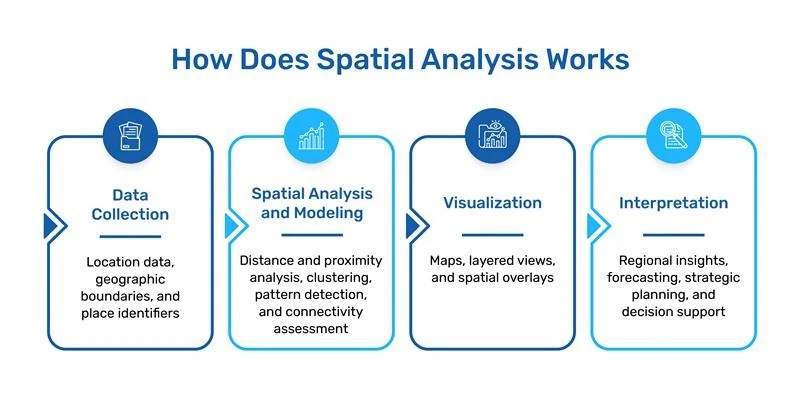
Spatial analysis follows a structured process that turns location-based data into actionable insights. While tools may vary, the workflow generally moves through data collection, analysis and interpretation.
- Data Collection
The process begins with gathering data that includes geographic context, such as coordinates, boundaries, or place identifiers. This data can come from spatial datasets, remote sensing technologies, or location-based business data that captures how the physical world is organized. - Spatial Analysis and Modeling
Once the data is collected, it is analyzed to understand how locations relate to one another. This includes examining distance, proximity, clustering, and connectivity between two or more places. Analytical models can be applied to detect patterns, compare regions, or identify trends that would not be visible without a spatial lens. - Visualization and Interpretation
Visualization plays a key role in interpreting spatial data. Maps often surface patterns that are difficult to detect in spreadsheets alone. By viewing data in geographic contexts, analysts can translate findings into insights that support planning, forecasting and improved decision-making.
Types of Spatial Analysis
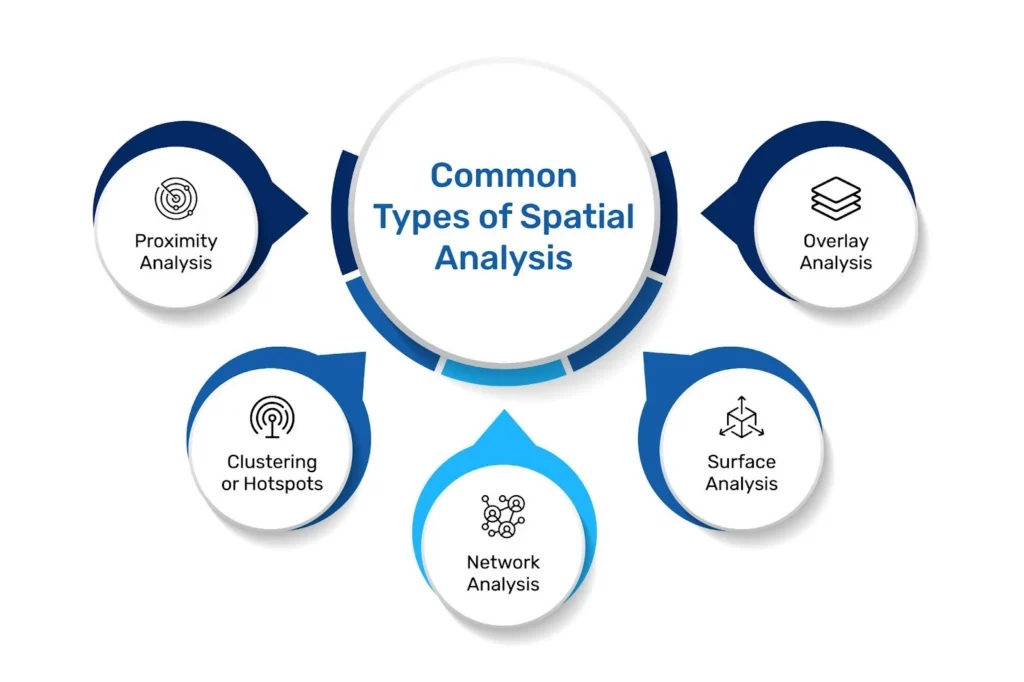
Different questions require different spatial approaches. Rather than relying on a single method, spatial analysis draws from a set of techniques designed to explore how location influences patterns, relationships, and outcomes.
Some analysis focuses on proximity, examining how closeness to other locations affects behavior, access, or performance. Others look for clusters or hotspots, identifying areas where activity is concentrated or changing rapidly.
Network-based analysis explores movement and connectivity, such as transportation routes, delivery paths, or commuter flows. Surface-based analysis examines how values vary continuously across space, such as population density, elevation, or accessibility.
In more advanced cases, spatial analysis incorporates statistical and modeling techniques to measure spatial dependence, compare regions, or understand how patterns shift over time. Overlay methods allow multiple spatial layers to be combined, revealing relationships that are not visible in isolation.
Each approach offers a different lens for understanding how geography shapes real-world patterns. The choice of technique depends on the question being asked, the type of data available, and the level of insight required.
Real-world examples of Spatial Analysis
A common real-world application of spatial analysis is retail expansion and consolidation planning.
Consider a retail brand deciding where to open new stores or close underperforming locations. By combining location-based data such as existing store locations, competitor presence, population density, and consumer movement patterns, spatial analysis helps identify areas of opportunity and risk.
Instead of relying solely on historical sales data, teams can visualize how customer activity flows across regions, how trade areas overlap, and where demands may shift over time. This allows decision-makers to act proactively, not reactively.
The same analytical approach applies beyond retail, from infrastructure planning to logistics optimization. What changes are the questions being asked. The underlying principle remains the same: using location-aware data to understand patterns that would otherwise remain hidden.
Data Required for Effective Spatial Analysis
Spatial analysis is only as strong as the data behind it.
Accurate coordinates, consistent place definitions, and well-maintained boundaries are essential for understanding how activity unfolds across locations. Just as important is freshness. Because the physical world changes constantly, outdated points of interest can quickly undermine analysis.
This is where working with a modern data partner matters. Reliable, regularly updated POI data ensures spatial insights reflect what exists on the ground today, not what existed months ago.
High-quality places data, including precise footprints, detailed attributes, and comprehensive coverage, provides the foundation needed to support meaningful spatial analysis across industries
Getting started with Spatial Analysis
In today’s data-driven environment, spatial analysis has become essential for understanding patterns, relationships, and decisions that are inherently tied to location.
Getting started doesn’t require understanding every tool in depth, it only requires clarity on the questions you are trying to answer and the data you rely on. Because spatial analysis relies on accurate, regularly updated data, and choosing a trustworthy data partner as a critical first step.