Key Takeaways
- Spatial data refers to information with a geographic component such as coordinates, addresses, or geometry.
- It represents real-world objects using points, lines, and polygons for mapping and analysis.
- Spatial data can also be stored as raster grids, useful for continuous data like weather or elevation.
- Visualization through maps makes it easier to uncover patterns and relationships not visible in tables.
- GIS tools help process, analyze, and visualize spatial data for real-world decision-making.
Eugene Chong is a product analyst at SafeGraph. With direct experience using this data, he covers the benefits of using geospatial data and shows you how you can use SafeGraph data in a variety of ways.
As the first presentation in SafeGraph’s Knowledge Series, Eugene sets the bar for educational seminars that teach you about how geospatial data can be used, as well as guidance on how to use SafeGraph data effectively for analysis.
What Is Spatial Data?
First, Eugene defines what spatial data is, explaining that it’s data containing spatial components such as coordinates, geometry, or addresses.
SafeGraphs’s data is geospatial in nature, as it refers to places on Earth, and relationships people have with places and spaces. This data is valuable for analytics in business, transportation, crime, economics, politics, and much more.
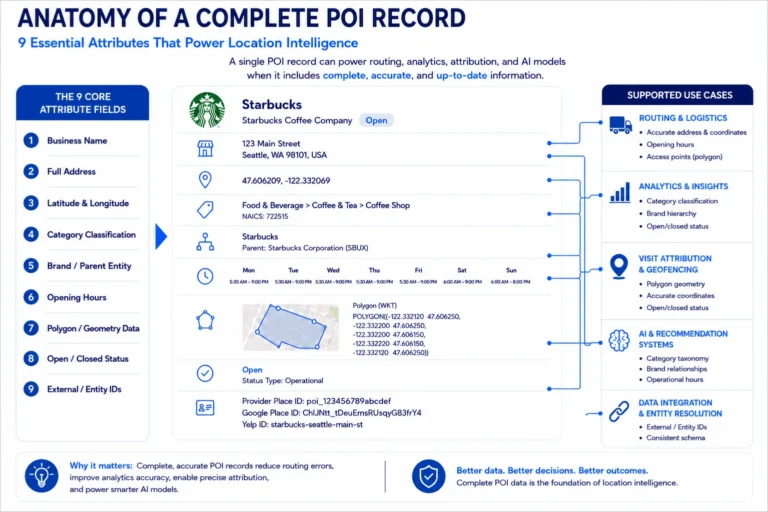
Spatial data uses vectors — points, lines, polygons — to define the shapes and structures of real-world objects and places on a map. For example, buildings are represented with precise polygons that show the shape, or footprint, of those buildings.
Other use cases, such as weather mapping, are more suited to raster grids than vector data. These determine averages within a set pixel size, and are particularly useful for representing data that is continuous (like land cover or elevation) rather than specific elements (like a POI or building footprint).
What Makes Spatial Data Powerful?
Data visualization is the main element that makes geospatial data so valuable, as it provides a simple, optimal way of analyzing data. Maps are extremely easy to analyze, and are a preferred method to use for analyzing geographic areas. Looking at data on a map reveals relationships and insights that cannot be seen in a table or a graph.
Eugene covers issues with accurately mapping data, and how data visualization can be manipulated to display data in certain ways. For example, gerrymandering is used as an example of how districts (or geographic areas) can be drawn in ways that suit specific needs, rather than accurately reflecting the true demographics of an area.
What Is GIS and What Are the Main GIS Tools?
To help you use geospatial data for yourself, Eugene explains what geographic information systems (GIS) are, and covers some of the best tools on the market by their type, including desktop, code-based, database, and web-based solutions. He then outlines the tools that he typically uses and why, touching on why you’d choose between different GIS tools for what you need.
He also outlines a general GIS workflow for evaluating new data. This covers ingesting data, exploring data, joining layers, and analyzing data. This helps walk you through the process of how to use a GIS solution to draw valuable insights from your data.
SafeGraph’s Places Data offers information on points of interest (POI) and building footprint data to places where people spend time or money, or business operations take place.
FAQ’s
1. What is spatial data?
Spatial data is information that includes location-based elements like coordinates, addresses, or geographic boundaries.
2. What are the types of spatial data?
The two main types are vector data (points, lines, polygons) and raster data (grid-based data like images).
3. Why is spatial data important?
It helps visualize and analyze geographic patterns, improving decision-making across industries.
4. What is GIS in spatial data?
GIS (Geographic Information Systems) are tools used to collect, analyze, and visualize spatial data.
5. Where is spatial data used?
It is used in business analytics, transportation, urban planning, weather mapping, and more.