There’s a problem that location intelligence teams, retail analysts, and logistics operators run into more often than they’d like to admit: POI data that looked fine at purchase starts drifting from reality almost immediately, unless someone is actually watching it, not just batch-refreshing it on a schedule.
The damage isn’t always obvious at first. A closed location that still shows as active skews foot traffic analysis. A duplicate record disrupts trade area calculations. An outdated address sends a driver to the wrong building. These aren’t just rare edge cases. In large-scale POI datasets, quality problems are common, often hard to spot right away, and the organizations relying on that data tend to absorb the cost without ever tracing it back to the source.
The trickier issue for buyers: coverage numbers tell you almost nothing about whether a dataset is actually good. A vendor can claim five million records across the US and still hand you something full of stale entries, duplicate listings, and metadata fields that are present but wrong. A record count is not a quality signal. What you need is a real framework for what “quality” means in POI data, and some solid way to verify it before you commit.
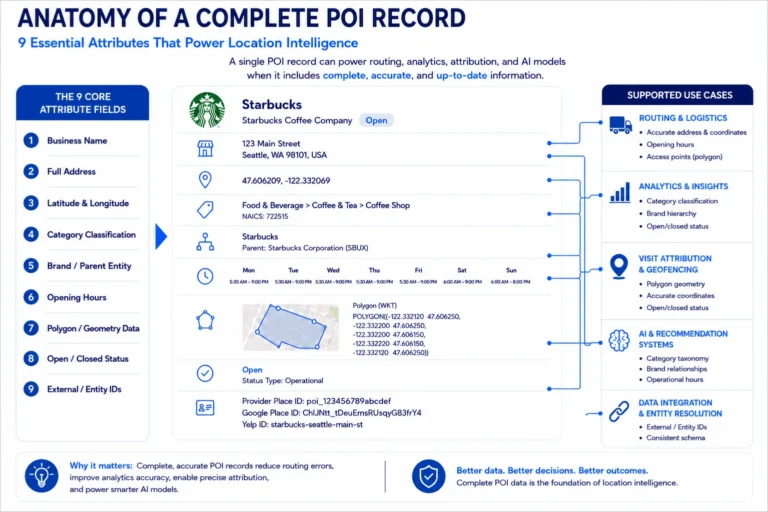
That’s what this guide is for. But if you’re newer to POI data, we’ve covered the full picture elsewhere: the complete guide to POI data, the full schema breakdown, and what makes a record complete.
Quick grounding point before we dive in: “quality” means different things to different vendors, so it’s worth pinning down what it actually means.
What is POI Data Quality
POI data quality is about how accurately, completely, and consistently a dataset reflects the real world. At SafeGraph, we think about this across three dimensions that actually matter for analytical work: Precision, Recall, and Completeness.
Precision asks whether the records in the dataset should be there at all and whether the details attached to each record are correct. A POI that exists in the dataset but is permanently closed, misclassified, or pinned to the wrong coordinates is a precision failure. Recall asks whether the dataset includes the places that actually exist in the markets you care about. A dataset missing 15% of the coffee shops in a given zip code has a recall problem, regardless of how many total records it contains. Completeness asks whether the attributes you need are actually populated and whether fill rates hold up across the categories and geographies relevant to your use case.
A dataset with five million records can still fail on all three. Quality is not about volume. It’s about how much you can trust each record to reflect what’s actually there, right now, in the real world.
Why Quality Matters More Than Coverage
It’s easy to treat record count as a shortcut for comprehensiveness. 200 million POIs sounds better than 100 million. But that logic falls apart once you start looking at what those records actually say.
Retail analytics teams use POI data to understand competitive density, trade area overlap, and store performance benchmarks. Feed that analysis a significant chunk of closed locations or misclassified businesses, and the conclusions get distorted. A retailer evaluating a new market shouldn’t be basing his decisions on invisible competitors that haven’t existed in two years.
Delivery and logistics operations depend on accurate addresses, suite numbers, and access points. A record that only has a street address, no unit number, nothing to distinguish the tenant, creates friction and failed deliveries. At scale, even a low error rate adds up fast.
Site selection teams need precise business density and category data to model catchment areas and evaluate market saturation. Duplicates and miscategorized records corrupt those models quietly, there’s no error message, just subtly wrong outputs.
Ad targeting and measurement workflows use POI data to build audience segments, define geofences, and attribute campaign visits. Low spatial precision and outdated hours make these pipelines unreliable in ways that are hard to diagnose after the fact.
Mobility intelligence, understanding how people move between places, needs clean, deduplicated POI anchors. If a single shopping center shows up as three separate records, movement analysis becomes fragmented and misleading.
Healthcare mapping such as care facility access, pharmacy coverage gaps or provider network density, all carries real-world stakes beyond analytics. Bad data here affects operational planning and, in some cases, skewed patient outcomes.
The pattern is consistent: quality failures don’t stay contained. They propagate through every model, analysis, and decision downstream.
How to Think About POI Data Quality
A single metric can’t tell you whether a dataset is good. You need to look across three interconnected dimensions and understand what breaks when each one fails.
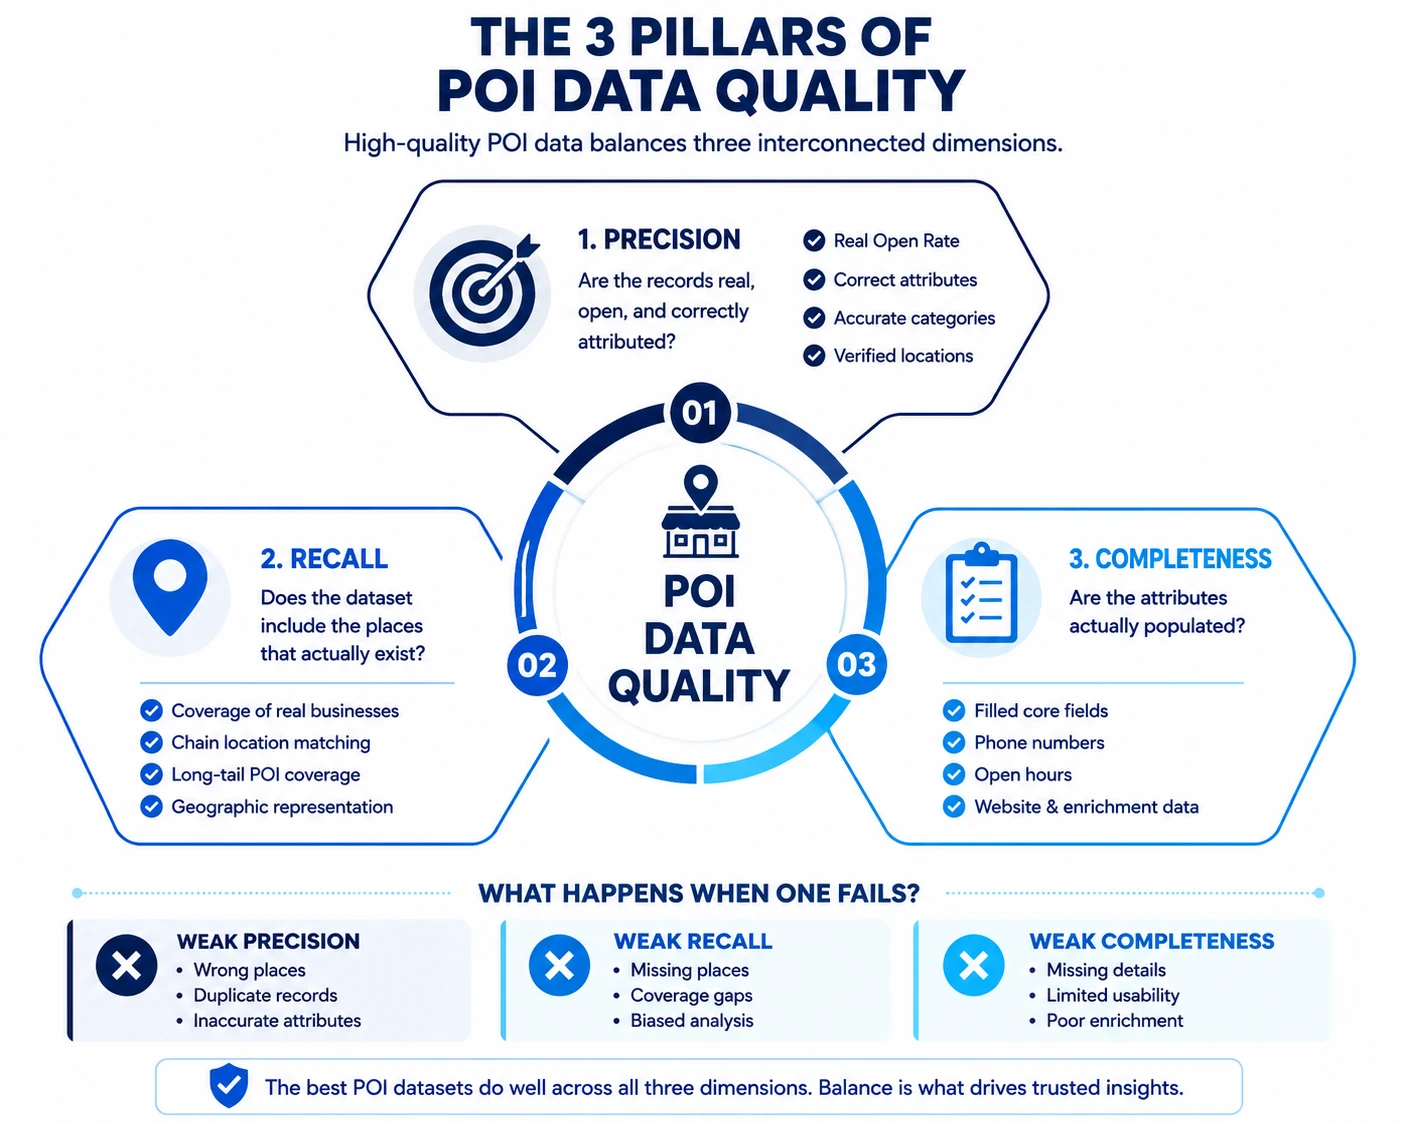
Precision: Are the records real, open, and correctly attributed?
Precision operates at two levels. Row precision asks whether a given record should exist in the dataset at all. Is it a real, currently open business? Or is it a permanently closed location, a home-based LLC, or a duplicate that slipped through? At SafeGraph, we track this through what we call the Real Open Rate, the percentage of POIs in our dataset that we’ve verified as real and currently open. The higher that rate, the more you can trust that the records you’re working with represent places people can actually visit.
Column precision asks whether the values within each row are correct. A record can exist legitimately and still carry wrong coordinates, an outdated phone number, or a misclassified category. Both matter. A dataset with high row precision but poor column precision gives you the right places with the wrong details.
Recall: Does the dataset include the places that actually exist?
Recall is coverage. It answers the question: of all the real, open businesses in a given market, what percentage does this dataset actually contain? For large national brands, the most practical way to test recall is to compare the dataset’s count for a given chain against that brand’s official store locator. If the dataset shows 13,800 locations and the store locator shows 14,200, that’s a recall gap of roughly 3%. SafeGraph targets branded chain counts within 0–2% of store locators for major chains with 1,000+ national locations, evaluated regularly across a randomized sample of 20 brands.
For long-tail POI, independent restaurants, local services, smaller operators, recall is harder to measure because there’s no clean reference list. SafeGraph tracks overall coverage through the Coverage Rate, benchmarked against Google’s real-open POI count, measured quarterly across both urban and rural zip codes.
Recall and precision involve real tradeoffs. A dataset optimized purely for coverage tends to pull in more unverified records, which hurts precision. A dataset optimized purely for precision filters aggressively, which risks dropping real places. The best providers are transparent about where they sit on that tradeoff, and how they’re working to improve both.
Completeness: Are the attributes actually populated?
Completeness is about fill rates. But not all fields carry equal weight, and treating them as if they do leads to the wrong conclusions.
Core fields, name, address, coordinates, and primary category, should be at or near 100% fill. A record missing any of these is functionally unusable for most analytical work. Enrichment fields operate under different expectations. Category fill rates above 90%, phone number above 70%, and open hours above 50% are the thresholds SafeGraph uses as benchmarks across the full dataset, with higher expectations for major branded chains where that data is more readily available.
The right question isn’t what’s the overall fill rate. It’s what’s the fill rate for the fields that matter most to your use case, broken out by category and geography. That’s where gaps usually hide, and it’s the first thing you should ask a vendor to show you.
These three dimensions interact in ways that matter. A dataset can be precise but have weak recall. High recall with thin completeness limits downstream utility. The best POI datasets do well across all three, and vendors should be able to show you published methodology for each, not just assert that their data is comprehensive. SafeGraph’s full evaluation framework, including methodology and benchmark thresholds, is documented at docs.safegraph.com/docs/places-data-evaluation.
How to Evaluate POI Data Quality Before Buying
The sample file a vendor sends you is not a sufficient basis for a purchasing decision. Most of the time it’s cherry-picked, clean in ways the full dataset isn’t. Here’s a more useful approach.
Pull samples from different geographies and categories
Request records across urban, suburban, and rural geographies. Ask for multiple business categories, retail, healthcare, food service, professional services. And look for the obvious stuff: missing phone numbers, coordinates that land in a lake, category labels that don’t match the business name.
Test against locations you know.
Pick 10–20 businesses you can actually verify, a specific hospital, a regional grocery chain location, a fast-food spot near your office. Check whether the address is right, whether the coordinates make sense, and whether the business is correctly marked as open. Check these against real sources of truth rather than trusting a single reference, Google Maps can be wrong about a centroid, so Street View is a good way to double check that a business is actually located where the data says it is. It’s a small sample, but it builds real intuition fast.
Ask about update cadence.
Ask how recently each record in the sample was validated, not when the dataset was last “refreshed.” There’s a difference between a pipeline that runs weekly and a process that actually verifies records. Many vendors conflate the two.
Spot check the coordinates.
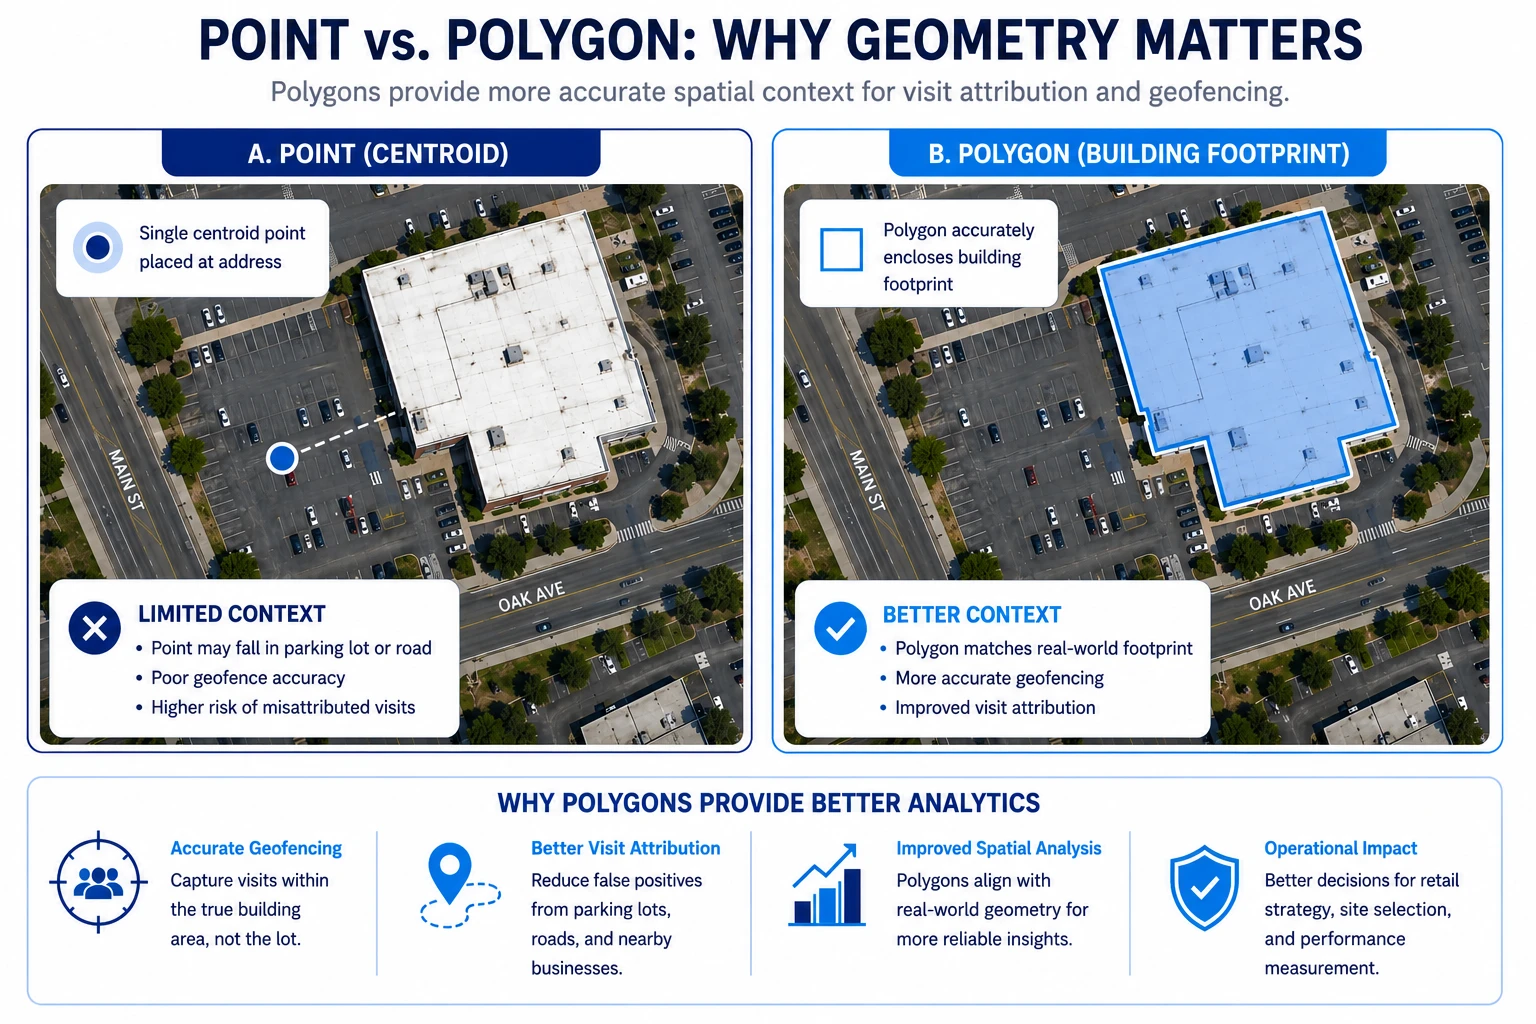
Cross-reference coordinates against satellite imagery for a handful of entries. The point should be inside the building footprint, not on the street or on an adjacent parcel.
Check category labelling.
Look at how the dataset handles similar businesses. Are two locations of the same grocery chain labeled identically? Is “coffee shop” applied consistently, or does it mix with “café,” “bakery,” and “food service”? Taxonomy inconsistency is one of the most common and most annoying problems to clean up after the fact.
Check fill rates.
Check fill rates on phone number, open hours, and brand affiliation, and ask the vendor what those fill rates look like broken out by geography and category, not just as an overall average. That’s where gaps usually hide, ask specifically what percentage of records actually have this data populated. Missing metadata means more enrichment work on your end.
Look for duplicates.
Search for the same business name within a tight geographic radius. If you find two records for the same physical location in a sample, there are almost certainly more in the full dataset. Also ask to see rural coverage specifically, sample files often skew toward urban markets where data is cleanest.
What Questions Should You Ask a POI Data Vendor?
Before signing a data agreement, push vendors to answer these questions specifically. Vague or deflective answers are themselves informative.
Data Coverage:
- Which geographies does your dataset cover, and are there markets you don’t serve?
- Are all the location types and business categories relevant to our use case included?
- Does coverage density hold up in suburban and rural markets, or is it concentrated in urban cores?
Schema & Attributes:
- Are building polygons available, or only centroid points?
- What taxonomy do you use, and how many levels does it have?
- How do you normalize category labels when source data is inconsistent?
- Can you map your taxonomy to NAICS, SIC, or another standard classification system?
Data Quality & Accuracy:
- How is spatial validation performed, automated checks, manual review, or both?
- What’s your deduplication methodology, and what’s your false-positive rate?
- How cleanly does the data structure differentiate between parent brands, corporate chains, and individual local entities?
- How do you handle complex or co-located entities, such as franchises, subsidiaries, or a brand-within-a-brand (e.g., a CVS pharmacy inside a Target)?
- How do you handle multi-tenant buildings where multiple businesses share the same address?
Freshness & Update Cadence:
- How much of the dataset is actively re-verified each month, and when is data delivered to customers?
- What is the average turnaround time between a real-world business closing or opening and its removal from the dataset?
- What signals do you use to determine that a business has opened or closed?
- What primary methods (e.g., web scraping, direct partnerships, crowdsourcing) do you use to detect and verify business closures?
Sources & Methodology:
- What sources do you use to validate business information, and how do you handle conflicting signals?
- Are you the primary creator of this POI dataset, or is it sourced/licensed from third-party vendors?
Identifiers & Integration:
- Do you provide persistent, stable place IDs that remain consistent across dataset updates?
- Is identifier mapping documentation available to support integration or migration workflows?
- What delivery formats do you support, API, S3, flat file, or other?
Support & Partnership:
- Is there a data dictionary available?
- How do you communicate known data gaps to customers?
- How do you handle customer feedback, if a customer discovers a data issue, what’s the resolution process?
- Where does your data perform better or worse across categories and geographies? A vendor who’s transparent about strengths and weaknesses is one worth trusting.
Once you have their answers, you need a way to score what you heard. The checklist below gives you a structured framework to do that, organized across the same seven dimensions, designed to be used during or right after a vendor evaluation call.
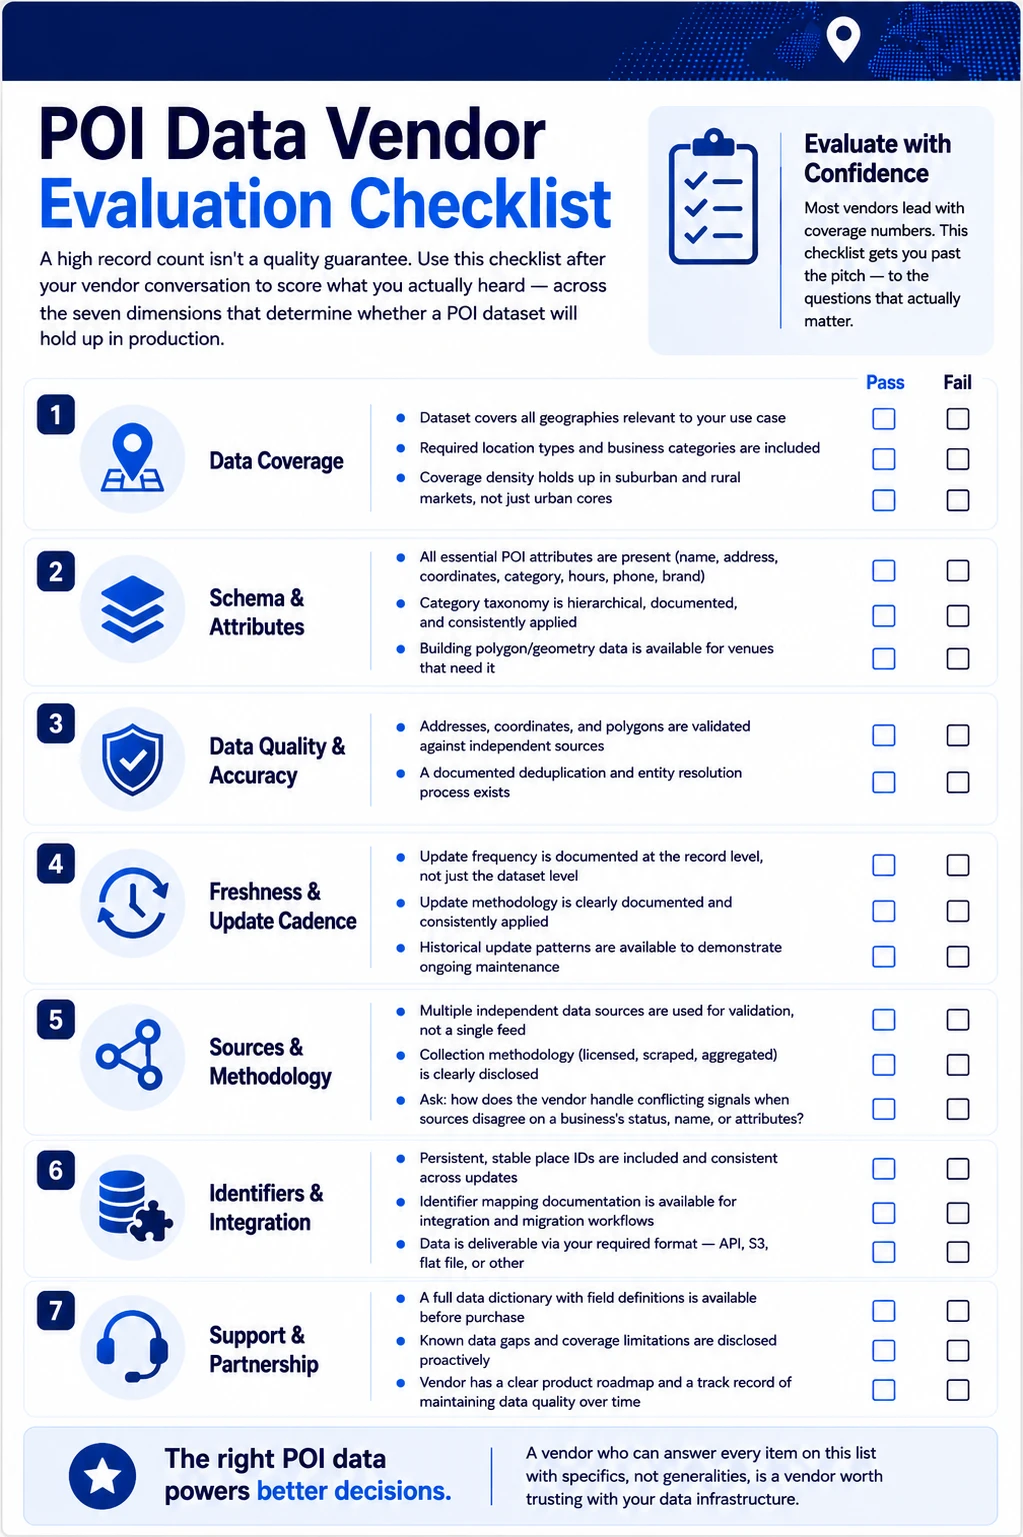
One important note on how to use this checklist: not every item applies equally to every vendor or use case. For Data Quality & Accuracy, the questions around validation methodology and deduplication are the ones that separate vendors with a real system from those without one. For Freshness & Update Cadence, the most useful question is how quickly closures are reflected after detection and what the typical lag is between a business closing in the real world and that status updating in the dataset. For Schema & Attributes, ask for fill rates broken out by field, category, and geography rather than a single aggregate number.
Common Red Flags in POI Datasets
Not all data quality problems announce themselves. Some of the worst ones hide in plain sight, and if you know what to look for, you’ll catch them before they cost you.
Duplicate records are probably the most common failure mode. They happen when you pull from multiple sources and nobody’s cleaned up the overlap. The result? Two entries for the same business, sitting side by side, with just enough variation to slip past naive detection. Different name formatting, coordinates off by a hair, “Pharmacy” in one row and “Drug Store” in another. Here’s what that looks like in practice:
Field | Record A | Record B |
Name | Sunrise Pharmacy | Sunrise Pharmacy LLC |
Address | 412 Oak Street | 412 Oak St |
Coordinates | 40.7128, -74.0060 | 40.7129, -74.0061 |
Category | Pharmacy | Drug Store |
Status | Open | Open |
If you find duplicates in a sample, assume they’re more common in the full dataset than they appear.
Thin metadata is another one. A record with just a name, coordinates, and a broad category isn’t particularly useful. If you’re seeing a lot of records with no phone number, no hours, no secondary categories, that sparsity will bite you downstream.
It’s also worth calibrating expectations by field tier. Core fields: name, address, coordinates, primary category should be populated on essentially every record. Enrichment fields like phone number and open hours operate differently: fill rates above 70% for phone and above 50% for hours across a full dataset are reasonable baselines. Significantly below those thresholds is a signal worth flagging.
Significantly above them for a given vendor is worth verifying, because a phone number field that passes a fill rate check but carries the same corporate headquarters number across 10,000 franchise locations isn’t actually useful data.
Category inconsistency causes headaches during analysis. When the same type of business shows up tagged as “Gas Station,” “Fuel Station,” “Petrol,” and “Service Station” across different records, any aggregation you try to do will be unreliable without significant cleanup first.
Stale operating hours are easy to overlook but genuinely painful. Hours change constantly, seasonal adjustments, pandemic-era shifts, policy updates. A dataset that hasn’t validated hours in six months is very likely wrong in ways you won’t notice until something breaks.
Missing suite or unit numbers matter more than most people realize. A single commercial address can house dozens of businesses. Without unit-level data, geocoding gets messy and visit attribution becomes a guessing game. This comes up constantly in healthcare and professional services data.
Weak rural coverage is structural. Most POI datasets are built on signals, web mentions, mobile data, app activity, that naturally cluster in cities. If a vendor isn’t actively compensating for that, rural areas quietly get worse coverage. Always ask for breakdowns by market tier, not just national-level stats.
Vague answers about update methodology should put you on edge. If a vendor can’t explain how they detect closures, how they handle duplicates, or how they validate coordinates, they probably don’t have a real system for any of it. Transparency isn’t a lot to ask for. Its absence tells you something.
No schema documentation or versioning is a sign of immature infrastructure. A well-run dataset has a data dictionary. Schema changes come with notice. If they can’t provide either, expect surprises.
How Modern POI Providers Maintain Data Quality
Good POI data doesn’t just happen. It requires real infrastructure, machine learning, validation logic, entity resolution, and it has to be maintained continuously, not just set up once and forgotten.
The providers that get this right don’t rely on a single source of truth. The clearest signal of a mature data infrastructure is published, verifiable accuracy metrics, not just vendor assertions.
SafeGraph evaluates its US POI data quarterly against two key metrics: the Real Open Rate (the percentage of records verified as real and currently open) and the Coverage Rate (the percentage of SafeGraph’s real-open POIs compared to Google’s count in the same geography).
These are calculated on randomly sampled zip codes: one urban, one rural and published publicly. That kind of transparency is rare in the POI industry, and it’s worth asking every vendor you evaluate whether they publish anything comparable.
Continuous refresh is what separates a dataset that’s technically “updated monthly” from one that’s actually current. The best providers don’t run a batch update and call it done. They have live pipelines watching for change signals, web scraping, partner feeds, user-reported data, and they push verified updates fast.
Entity resolution is the unglamorous hard part. It’s the process of figuring out whether two records actually refer to the same business, and building out the parent-child relationships between brand and individual location. It requires fuzzy matching, spatial proximity checks, attribute comparison. It’s expensive and genuinely difficult, which is exactly why lower-tier vendors tend to skip it.
Automated QA catches problems before they get into the main dataset. Coordinates that land in the ocean. Phone numbers that don’t parse. Addresses that won’t geocode. These should be flagged and reviewed, not silently passed through.
Geospatial validation goes further: making sure coordinates actually match the stated address, that points fall inside the right parcel boundaries, that building-level precision is maintained. For use cases like visit attribution or geofencing, this matters a lot.
The best providers have also built early-warning systems, change detection that flags probable business updates before they’ve fully propagated. Brand acquisitions, updated web presence, new permit activity: these are signals worth catching early.
This is the infrastructure that separates a dataset you can trust for serious analytical work from one that only holds up for exploratory use.
Closing Thoughts
Evaluating POI data comes down to three questions. Are the records in the dataset real and correctly attributed? Does the dataset cover the places that actually matter for your markets? And are the attributes you need actually populated at the fill rates your use case requires? Those are Precision, Recall, and Completeness, and they’re the right lens for any serious vendor evaluation.
Coverage numbers are easy to put in a deck. Precision and recall metrics backed by a published methodology are harder to fake. Ask every vendor you evaluate whether they publish their accuracy metrics publicly, what their real-open rate looks like, how they benchmark coverage, and whether those numbers are broken out by geography and category or just reported as a single national average.
The value of a POI dataset plays out over time, every time a model runs, a geofence fires, or a site selection decision gets made. A dataset that degrades quietly creates compounding problems that are genuinely hard to trace back to the source. That’s why the question isn’t just what the data looks like today. It’s how the provider tracks quality over time, how they communicate degradation, and what you can access to verify it yourself.
SafeGraph publishes its Real Open Rate and Coverage Rate quarterly, benchmarked against Google for US POI, because buyers deserve verifiable signals rather than vendor assertions. You can evaluate us against the same framework this guide describes. The methodology is documented at docs.safegraph.com/docs/places-data-evaluation.