Location is not simply another column in a dataset. It is the structure that defines how observations relate to one another. In spatial analysis, this underlying arrangement of relationships is often referred to as spatial structure. Analysts working with spatial data are not just analyzing values across observations. They are examining how outcomes are shaped by proximity, clustering, accessibility, and movement. This is an analytical process which is formalized using spatial data analysis. It supplies the statistical and computational framework to detect geographic patterns, measure spatial dependence, and model location-driven behavior.
With companies increasingly using geospatial intelligence for retail expansion, infrastructure planning, mobility research, and risk assessment, the level of spatial analysis, and therefore development of spatial techniques, has increased. But the most crucial concern for a model lies in the quality and consistency of the data underlying it. It is thus necessary to know about these techniques. On the other hand, it is equally important to ensure reliable inputs.
What Spatial Data Analysis Really Entails
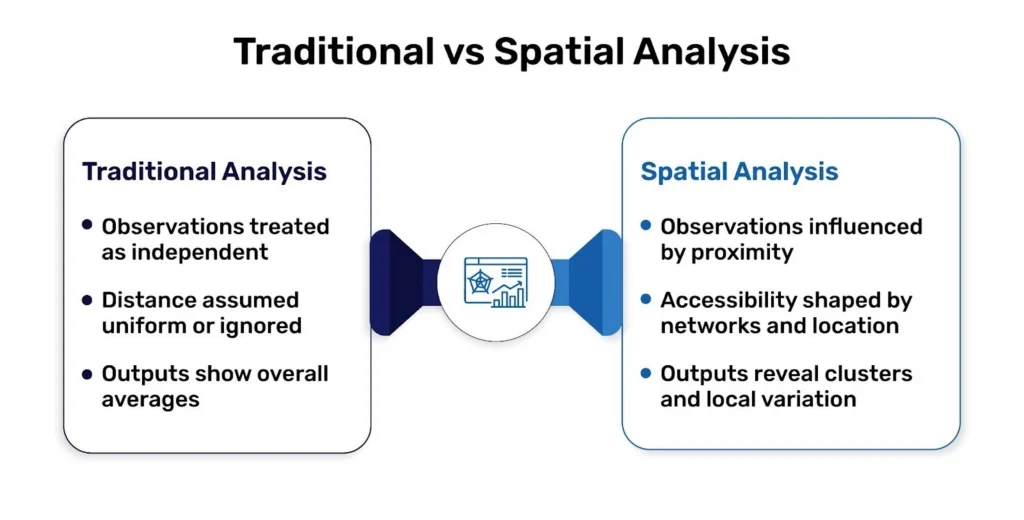
Spatial data analysis refers to the analytical treatment of data that contains geographic coordinates or spatial geometry. Unlike conventional statistical analysis, it does not assume independence between observations.Spatial datasets possess an underlying spatial structure, meaning that relationships are shaped by location and arrangement in space. There are often nearby effects between entities. This phenomenon is called spatial autocorrelation and requires specialized methods that explicitly account for spatial relationships.
Spatial data are usually represented in two forms. Vector data are the discrete elements like points of interest, road networks, or administrative boundaries. Raster data are continuous surfaces like elevation, temperature, or satellite imagery. A thorough spatial analysis combines geometrical data together with attribute data to find patterns that are invisible in non-spatial data.
Why Spatial Structure Changes Decision-Making
The role of spatial data analysis is to unveil relationships determined by geography. However, retail performance may vary from neighborhood to neighborhood, not solely because of demographics, but because of accessibility, competitive density, or consumer mobility patterns. There could be some “cluster-ish” public health outcomes in certain districts because of environmental exposure or infrastructure constraints. Logistics efficiency is less a function of straight-line distance than it is of network connectivity and travel time.
These trends are not coincidental. They are structural. Ignoring spatial relationships will lead to biased judgments and incorrect strategic decision-making. Integrating them will help in producing predictions more effectively, better allocation of resources, and stronger predictive models.
Core Techniques in Spatial Data Analysis
Structural analytical methods underpin the professional geospatial workflow. Each tackles a distinct aspect of spatial form.
Spatial Descriptive Statistics
The first level of insight is provided by spatial descriptive statistics. Descriptive statistics such as mean center, standard distance, and spatial autocorrelation quantify to what extent points tend to cluster, disperse, or follow definite geolocation. In the domain of retailing this might include looking at whether store locations are focused in high-density corridors or well dispersed, geographically, in a metropolitan region. These baseline metrics inform every modeling choice.
Buffering and Proximity Analysis
Buffering and proximity analysis proceeds from distribution to influence. A buffer is a zone about a geographic feature at a given distance. Analysts implement buffers to model service areas, assess competitive overlap, or establish infrastructure access. In practice, a trade area might be defined by a five-mile radius or, more plausibly, by a ten-minute drive-time isochrone. So here is where spot positions and up-to-date location data are important. Even small geocoding errors can materially distort competitive assessments.
Spatial Entropy and Distribution Analysis
Diversity and concentration within geographic boundaries can also be analyzed using spatial entropy and distribution analysis. In commercial settings, entropy can be used to measure the distribution of different categories in a district, allowing us to determine if there is a single segment dominating the retail corridor or an even distribution of the district. Meaningful comparisons across regions depend on uniformity across classification standards.
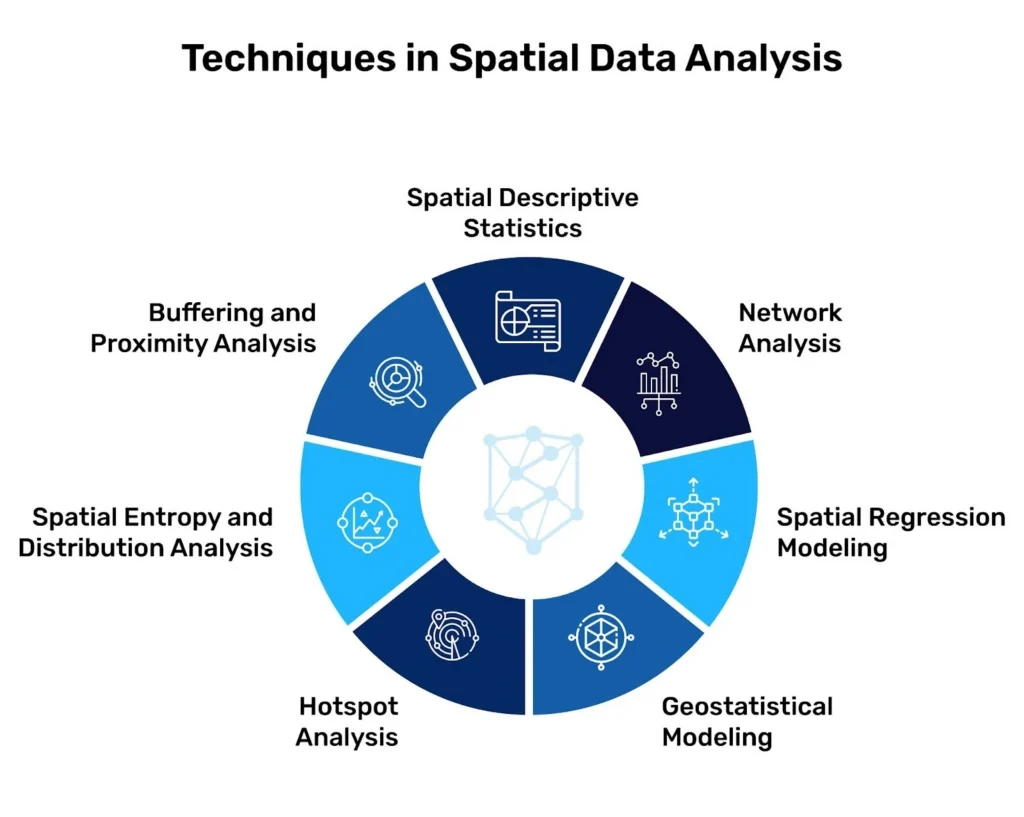
Hotspot Analysis
Hotspot analysis detects statistically significant high-value or low-value clusters. Analytics, such as with Getis-Ord Gi* statistic, helps to identify regions where activity is greater than the random distribution would predict. In practice, this could mean finding high-demand retail locales, centers of mobility aggregation, or hotspots of risk. Accurate cluster detection depends on detailed data with little redundancy and exact representation in space.
Geostatistical Modeling
Geostatistical analysis takes modeling by the spatial level to prediction. Methods like kriging and variogram modeling estimate those values at unobserved areas while quantifying uncertainty. Such strategies are common in environmental science, resource modeling, and demand prediction. Data structure and low-noise datasets reduce unstable interpolation models and increase confidence intervals.
Spatial Regression Modeling
Spatial regression includes geography as an explicit element of predictive models. Classical regression relies on independent observations. Spatial regression resolves this by accounting for geographic spillover effects. For instance, retail sales in one neighborhood may be affected by commercial presence in adjacent areas. When they include spatial lag or spatial error terms, analysts gain a more dependable explanatory model.