
A building footprint may seem like just a polygon (or set of polygons) on a map, but it’s so much more than that. As of 2026, open datasets alone map billions of structures worldwide: Google’s Open Buildings project covers roughly 1.8 billion buildings across 58 million square kilometers of Africa, Latin America, and South and Southeast Asia, while Microsoft’s Global ML Building Footprints project has independently mapped over 1.4 billion buildings across the rest of the globe. Yet coverage, positional accuracy, and update frequency still vary widely by region and provider, which is exactly why GIS and location intelligence teams often pair open data with commercial sources for production use.
So what exactly is a building footprint? What can it be used for? And where can you get accurate building footprint data? We’ll answer all of these in the sections below.
What Is a Building Footprint and Why Is It Useful?
The definition of a building footprint is a polygon, or set of polygons, representing a specific building in the physical world. It provides a ground-centered visual representation of a building’s location, shape, dimensions, and area. It may also include other geospatial information as well.
This applies whether you’re looking at the footprint of a single house or the polygon for a 40-story tower: it’s a ground-level, shape-accurate representation of the structure, not just a raw square footage number.
This information can include:
- Address: address strings that include attributes such as street number and name, city, state, and ZIP code.
- Latitude/longitude: geographic coordinates that allow locations to be geocoded and mapped.
- Place: a categorical attribute that describes a building’s general purpose (e.g. residential, commercial, or industrial) and/or its specific use case (e.g. an electronics store).
- Spatial hierarchy: metadata that provides information about individual units within buildings (e.g. apartments, stores in malls, or offices in business complexes), and how they are spatially related to both each other and the building that contains them. Read more about how spatial hierarchy works in the technical guide to SafeGraph Places data.
Building footprints are useful because they provide detailed delineations of structures or parts of properties, offering more insight than simple point of interest (POI) data. For example, when comparing building footprint vs. building area, the former lets you visualize what a building is shaped like and how much space it takes up relative to its surroundings. The latter can tell you how large a building is, but not how that area is distributed or oriented on the plot.
Building footprint data is a great tool on its own, but becomes even more useful when combined with other types of geospatial data, and when you understand how that data is actually made.
Building Footprint vs. Building Area
Building footprint and building area are often used interchangeably, but they answer different questions.
Building area is a single number, typically expressed in square feet or square meters, describing the total floor space or ground space a structure occupies. It is useful for quick comparisons, but it does not describe a building’s shape or how that space is arranged.
Building footprint goes further. It shows the outline of a structure, capturing shape, orientation, and how a building sits relative to its surroundings, such as neighboring structures, roads, or open land. Two buildings can share an identical area of 10,000 square feet and look completely different once you look at their footprints. One might be a compact square, the other a long, narrow rectangle wrapping around a corner lot.
This distinction matters for analysis. A footprint lets you see whether a building is likely to cast shadows on a neighboring lot, whether it leaves room for parking or landscaping, and whether its shape creates blind spots or accessibility issues. The area alone cannot answer any of those questions.
Building Footprints vs. Centroid Based Geocodes
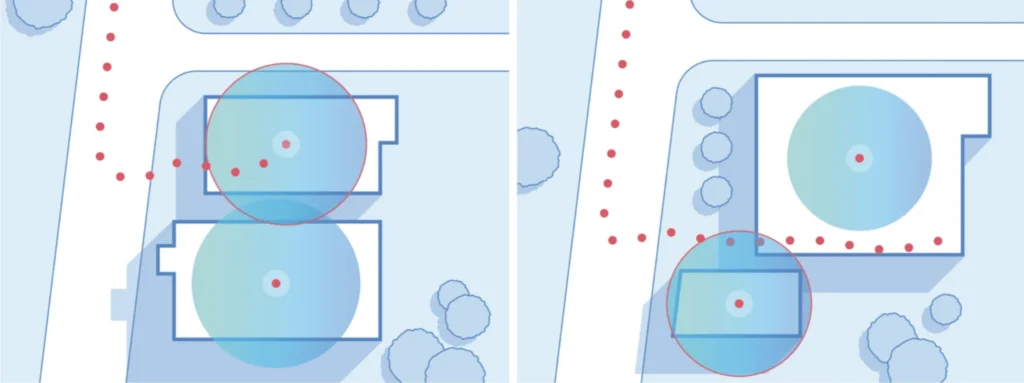
Articulating the actual dimensions that represent the true shape of a POI, in the form of a building polygon or geofence, provides useful data to understand and visualize the true nature of a POI in ways that traditional geocoding data cannot.
Address point and street level geocodes only provide approximate measures of occupied space based on the center point of a building and its distance to an adjoining parking lot or nearby street curb. This creates a radius used to explain, in broad strokes, a building’s general footprint.
Building footprint or rooftop geocodes, on the other hand, precisely identify the actual space a POI occupies by using real rooftop specifications rather than center points. This helps avoid overlaps and erroneous radiuses in the data, one of the biggest downsides of centroid based data, which can undermine the accuracy of geospatial analysis.
How Is Building Footprint Data Created?
Footprints aren’t traced by hand at scale, they’re detected by neural networks trained on millions of labeled building outlines, and the accuracy of any footprint dataset comes down to which method and model architecture built it.
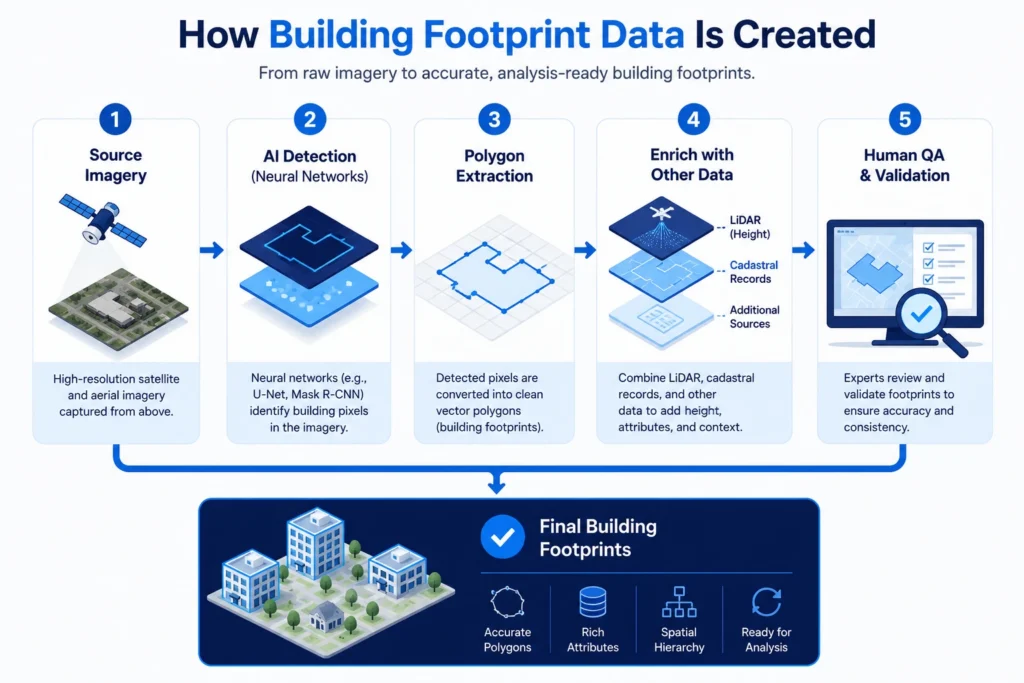
Semantic segmentation is the dominant method.
Most large open datasets run a convolutional network over satellite or aerial tiles, classify each pixel as “building” or “not building,” and convert that mask into a polygon. Google’s Open Buildings project, for instance, is built on a U-Net architecture trained with mix-up augmentation and a soft KL-divergence loss, validated against 100,000 labeled African images before the model was scaled to production. Academic benchmarks for this task, run on public datasets like SpaceNet, show newer architectures such as Mask R-CNN and HRNet-based models regularly hitting F1 scores in the 87 to 95 percent range on clean, high-resolution imagery, though that number drops meaningfully in dense urban cores, informal settlements, or anywhere shadows and adjacent rooftops blur building edges. That gap between lab benchmark and real-world coverage is exactly why a raw accuracy claim from a provider is worth a skeptical second look: ask what terrain and building density the number was tested on.
LiDAR adds a height dimension imagery-only methods can’t.
Airborne or vehicle-mounted LiDAR sensors fire laser pulses and measure the return time to build a 3D point cloud, which is why LiDAR-derived footprints double as the primary source for building height data. Where imagery isn’t available, some pipelines estimate height indirectly from shadow length in the source image; a 2026 study extracting building heights across Shanghai this way processed over 750,000 structures with an R² of 0.74 against ground truth, a workable but noticeably less precise substitute for LiDAR.
Cadastral records and human QA round out the picture.
Local governments maintain parcel and structure outlines for tax and zoning purposes, a strong accuracy source but inconsistent in format and refresh rate across jurisdictions. That inconsistency is why commercial providers layer human verification on top of model output: automated extraction reliably misreads shadows, merges adjacent rooftops into a single polygon, or misses construction that happened after the source imagery was captured.
SafeGraph’s own pipeline is a practical example of this layering in action. We pull from thousands of sources, from satellite imagery to municipal records, and supplement model output with hand-drawn polygon verification to catch the shadows, merged rooftops, and outdated construction that automated extraction alone tends to miss. We also tag sub-stores within malls, stadiums, airports, and similar structures in relation to their parent store geometry, which is what makes the data usable for spatial hierarchy analysis rather than just a flat set of outlines.
If you’ve ever searched for how building footprint area is calculated: once a polygon is drawn, the area is computed directly from its coordinates using standard planar or geodesic area formulas. That’s a straightforward geometry step, but it’s only as accurate as the polygon feeding it, which is why extraction method and QA matter more than the math itself.
2D vs. 3D Building Footprints
Most footprint data in circulation today is 2D: a flat polygon with no elevation information. 3D footprints add three things a flat polygon can’t capture:
- Height: typically LiDAR-derived or shadow-estimated, as covered above.
- Floor count: modeled from height divided by an assumed floor-to-floor measurement (commonly 3 to 4 meters per floor for typical commercial and residential construction).
- Roof geometry: flat, gabled, hipped, or complex, which matters for both solar and wind-load modeling.
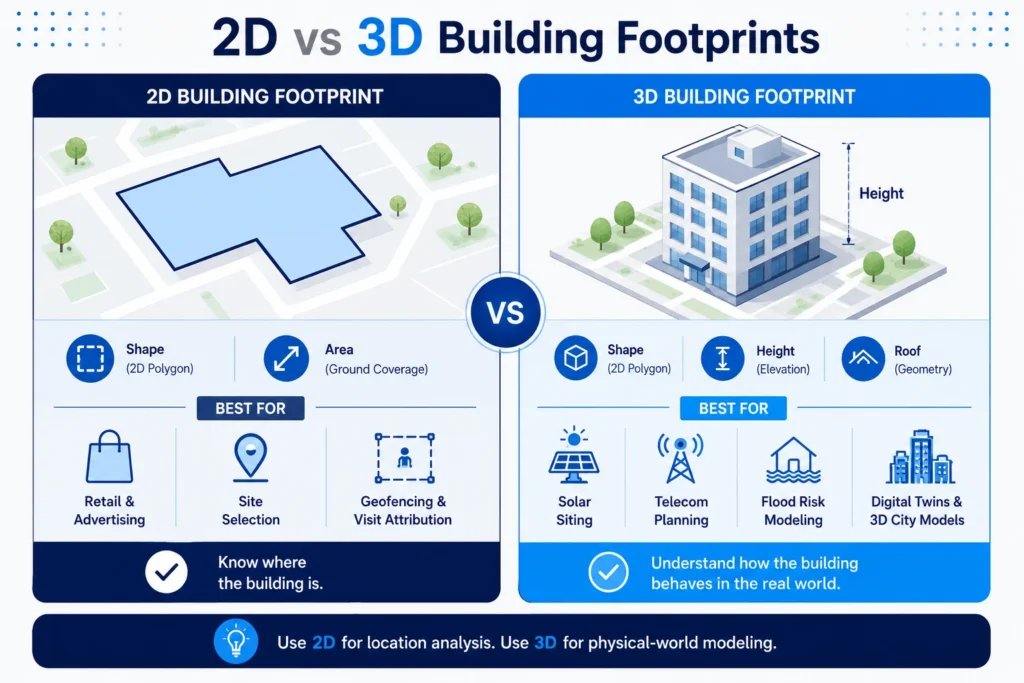
Where 2D genuinely isn’t enough:
- Solar siting needs usable roof area and orientation, not just a footprint outline, to model panel yield.
- Telecom line-of-sight planning needs the height of every structure between a proposed tower and its coverage area, not just where those structures sit on the ground.
- Insurance and flood risk modeling increasingly weights first-floor elevation over footprint area alone; FEMA’s flood insurance rate mapping, for example, treats elevation relative to base flood elevation as the single biggest factor in a structure’s flood risk score, something a 2D polygon can’t express on its own.
- Digital twins, the 3D city models cities like Singapore (Virtual Singapore) and Helsinki have built for infrastructure and climate simulation, require height and roof geometry as baseline inputs, not an add-on.
For most retail, advertising, and site selection work, a precise 2D polygon is plenty; that’s what powers geofencing and visit attribution, covered in SafeGraph’s geofencing guide and visit attribution guide. 3D becomes necessary once the question shifts from “where is this building” to “what happens to this building under a specific physical condition.”
10 Industry Use Cases for Building Footprints
So what is a building footprint actually used for in a business context? As we mentioned, it’s usually combined with other types of data for various applications. Here are 8 common ones.
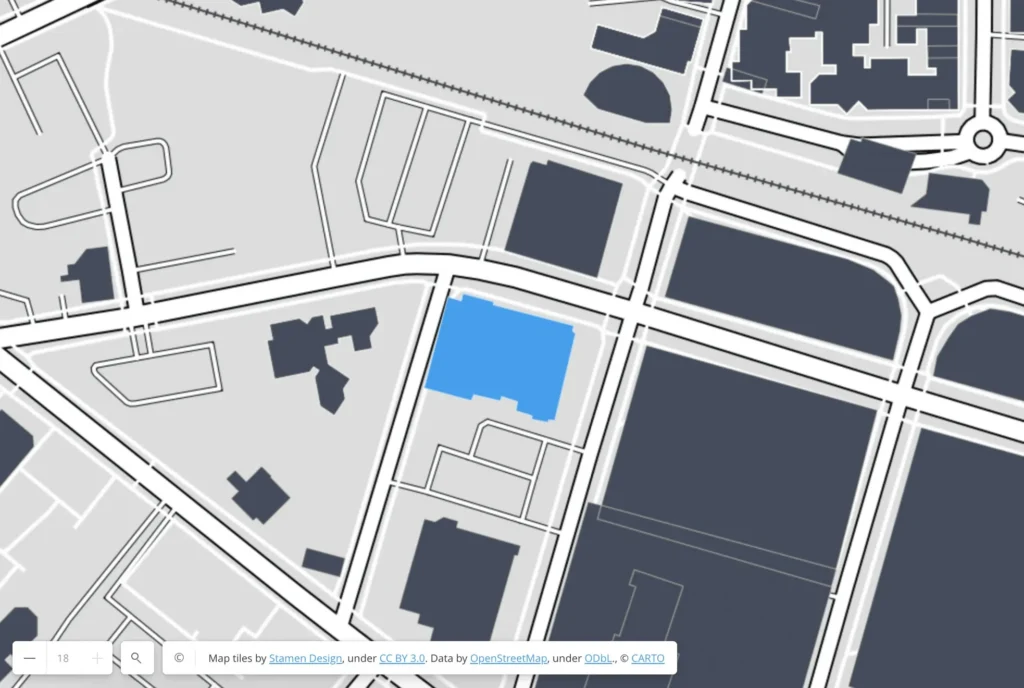
1. Retail: advertising, store layout planning, and site selection
Retailers commonly pair building polygon data with mobility or foot traffic datasets from specialized providers to perform visit attribution: how close people get to a store, how many actually enter, and how long they stay. It’s worth being precise about which data does what here: the footprint (SafeGraph’s Geometry product) defines the precise boundary a visit is measured against, while mobility data, sourced separately, supplies the device movement itself. SafeGraph’s visit attribution methods breakdown shows why a polygon-based boundary produces meaningfully more accurate attribution than a simple radius around a store’s centroid.
Retailers use this combined view to plan where to advertise around a store, rearrange layouts around popular departments, and decide whether a location is worth keeping open.
2. Mapping: creating accurate maps of assets, amenities, etc. for both industry and consumer consumption
When mapping a building, it’s important to use the footprint to understand how it interacts with other nearby spaces. Some buildings are irregularly shaped to meet terrain constraints or design choices, and multi-level buildings may not have the same profile on every floor.
Spatial hierarchy matters here too. Basic address data combined with POI data can help route to a building, but it isn’t enough for a building with multiple smaller units inside it, like a mall, apartment complex, or office tower. In these cases, the footprint must be calculated and drawn for each unit and/or building, which is what makes mapping data accurate for both navigation and further analysis. For readers new to how this underlying data works, SafeGraph’s spatial data and GIS 101 primer is a good starting point.
3. Telecommunications: planning network infrastructure
Telecom companies expanding into sparsely populated areas need accurate building footprints to properly position cellular towers and other infrastructure. They compare tower plans against available land, signal range, and the footprints of nearby buildings, since a structure’s height and location can interfere with signal transmission. This helps companies achieve maximum coverage with the minimum number of towers. This kind of multi-layer infrastructure analysis, footprints combined with terrain and demographic data, is covered in more depth in SafeGraph’s geospatial data analytics guide.
4. Insurance: co-tenancy and adjacency risk assessment
Insurance companies require accurate, precise polygon data to evaluate risk. By measuring a building footprint’s area and position on a plot, insurers can assess vulnerability to flooding, terrain-related damage, or proximity risk from neighboring structures. Spatial hierarchy metadata also helps here: an apartment complex with more individual units carries a different risk profile than a standalone home, and a retail store’s risk profile can shift depending on what’s located near it inside a larger building.
5. Urban planning
Building footprint data helps government agencies and civil engineers plan infrastructure, plumbing, electricity, sidewalks, and accessibility features around existing structures. It also helps planners maintain a balance between built space and land reserved for parks, yards, and conservation areas.
Planners often layer footprint data against mobility data from a separate provider to understand how population flow interacts with building density and where transportation networks or new public facilities are needed.
6. Disaster response and emergency management
Emergency responders overlay pre-disaster building footprints with post-event satellite or radar imagery to flag collapsed or damaged structures quickly. This approach was used after the 2023 Kahramanmaraş earthquake in Türkiye, where researchers matched existing footprint outlines against post-event imagery to classify damage across multiple cities without needing “before” photos of every building. The result is a damage map produced in hours rather than days, which speeds up evacuation prioritization and rescue deployment.
7. Environmental analysis and climate modeling
Building footprints feed directly into urban heat island modeling, since footprint density is the clearest available proxy for how much heat-retaining surface exists in an area versus how much vegetation is left to offset it. The EPA’s research review found U.S. urban areas run 1 to 7°F warmer during the day and 2 to 5°F warmer at night than surrounding areas, largely driven by building density. City sustainability offices use this kind of footprint-based modeling to decide where tree-canopy or reflective-roofing programs will have the most impact.
8. Autonomous vehicles and HD mapping
Self-driving systems can’t rely on GPS alone in dense cities, since tall buildings cause signal bounce (the “urban canyon” effect) that throws off positioning by meters. Instead, vehicles use LiDAR to scan nearby building facades in real time and match that scan against a reference map built from known building footprint outlines, achieving meter-level positioning accuracy. Since buildings don’t move, they make a stable anchor for correcting GPS drift exactly where GPS is least reliable.
9. Mobile marketing: location based audience targeting
Building footprint data supports mobile marketing by helping brands target, reach, and engage location based audiences based on their proximity to a property or structure. Rather than relying on an approximate radius around a business, marketers can use the actual footprint to define more accurate targeting zones and measure engagement with greater confidence.
10. Navigation: precise road and route geometry
Accurate building footprints also support navigation by enabling precise maps with correct road geometry. Knowing exactly where a structure begins and ends, rather than relying on an estimated center point, helps routing systems avoid errors near dense intersections, campuses, or multi-unit complexes.
Common Building Footprint Data Formats
Format | Best For | Why |
Shapefile (.shp) | Legacy GIS software (Esri ArcGIS) | Broadest software compatibility, but splits data across multiple linked files (.shp, .shx, .dbf) |
GeoJSON | Web mapping, JS applications | Human-readable and works natively with Leaflet/Mapbox, but slower and larger at scale |
KML/KMZ | Google Earth, lightweight visualization | Simple to view, not built for analytical queries |
WKT (Well-Known Text) | Database storage (PostGIS, BigQuery GIS) | Plain-text geometry, easy to store and index in SQL |
GeoParquet | Cloud-scale analytics (Snowflake, Databricks, BigQuery) | Columnar and compressed; typically a third to half the size of an equivalent Shapefile or GeoJSON, with spatial filters running 10 to 100x faster when bounding-box metadata is used |
That performance gap isn’t marginal at scale. In independent benchmarking, converting a roughly 500 MB building footprint CSV into GeoParquet took about 11 seconds, versus well over a minute and a half for Shapefile or GeoPackage output of the same data. For teams pulling footprint data into a modern data warehouse rather than a desktop GIS tool, that’s the difference between a query that runs and one you wait on.
SafeGraph delivers Geometry data in WKT format specifically so it drops into PostGIS or BigQuery GIS workflows without a conversion step.
How to Evaluate Building Footprint Data Quality
Four dimensions actually separate a usable footprint dataset from an unreliable one:
- Positional accuracy. How closely the polygon matches the true building outline, usually stated in meters of tolerance. LiDAR-based footprints can hit sub-meter accuracy; footprints from lower-resolution imagery or dated cadastral sources often only get you to several meters.
- Completeness. What share of real buildings in a region actually got mapped. This varies more than people expect, even between two open datasets covering the same continent: peer-reviewed comparisons of Google’s and Microsoft’s global footprint datasets found Microsoft’s models tend to merge adjacent structures into single, larger polygons, while Google’s models detect more individual buildings at smaller average size. That means a straight building-count comparison between providers can be misleading without also checking how footprints are being segmented.
- Currency. How often the data refreshes. New construction and demolition can make a footprint stale within months in fast-growing metros; Microsoft’s own dataset changelog, for comparison, shows incremental updates arriving multiple times a year as new imagery becomes available.
- Attribute richness. Whether you get more than a bare polygon: address, place type, spatial hierarchy, height, or just an outline with no context attached.
Open datasets (OpenStreetMap, Microsoft Building Footprints, Google Open Buildings) are a solid starting point for prototyping. For production use cases like site selection, geofencing, or risk underwriting, where a merged or missing polygon has a real cost, commercial datasets generally win on completeness and refresh cadence. SafeGraph’s guide to geospatial data sources breaks down how different providers, open and commercial, stack up across these same dimensions.
Where to Get Building Footprint Data
Building footprint calculation is tedious and time-consuming to do on your own. That’s why it’s much easier to purchase pre-processed data from a company like SafeGraph, which specializes in collecting, cleaning, and organizing this data at scale across our 80M+ points of interest.
SafeGraph’s Geometry datasets dataset offers building polygon data with 15 different attributes. Our building footprint database includes spatial hierarchy metadata (see the Places data technical guide for schema details), as well as detailed information about each building as a point of interest, and pairs naturally with our Places dataset for a fuller picture of what’s happening at a location. If you’re comparing providers before committing to one, our geospatial data sources guide is a useful side-by-side reference.
Building footprints are versatile geospatial data that can be valuable across many industries, but they’re only valuable insofar as they’re precise. That’s why we focus on the coverage, accuracy, and spatial hierarchy computation behind our polygon data.