
Trade area analysis used to be a nice to have for real estate teams and grocery chains. In 2026, it is a survival tool. Coresight Research counted 8,270 US store closures against only 5,270 openings in 2025, a net loss of roughly 3,000 locations, even as a handful of chains kept opening stores in the same markets others were abandoning. The difference between a location that thrives and one that closes usually comes down to how well the team understood the trade area before signing the lease.
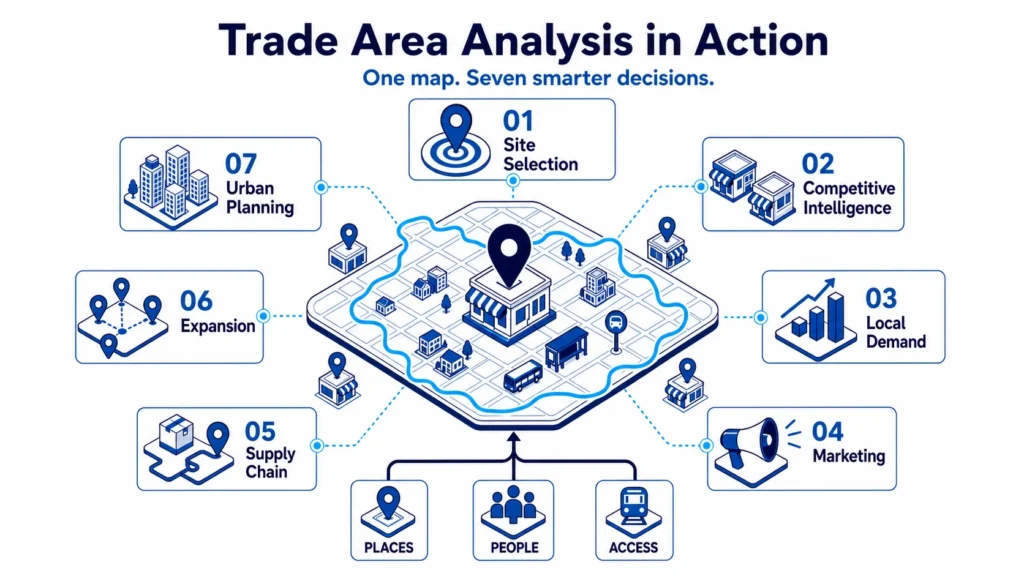
Done well, trade area analysis touches far more than site selection. It shapes marketing, inventory, expansion sequencing, and even how cities plan services. Below are seven benefits, each paired with a real data visualization and the data behind it, so you can see what the analysis actually looks like instead of reading about it in the abstract.
What Is Trade Area Analysis?
Trade area analysis is the study of trade activity: who is buying what, from whom, and where, within a defined geographic area. It typically layers three types of data: point of interest data on the businesses already operating in the area, demographic and demand data on the population, and accessibility data on how easily people can reach a site by car, foot, or transit.
For a deeper look at the methods analysts use, from simple buffer rings to isochrone based models, see the complete catchment area guide. The rest of this article focuses on what trade area analysis actually delivers once the data is in hand.
1. Site Selection
Site selection is the original use case for trade area analysis, and it is still the highest stakes one. A bad site decision does not just cost the lease, it shows up months later as one of the thousands of closures Coresight tracks every year.
A useful visualization here is a buffer map: concentric rings drawn around a candidate site showing every competitor within a half mile, one mile, and three miles. SafeGraph’s own catchment area guide walks through a worked example: a national pharmacy chain ran one mile buffer analysis across 600 stores using SafeGraph Places data and flagged 47 locations where a direct competitor sat within 0.3 miles, before the next lease renewal cycle.
That kind of speed only works because the underlying POI data is current. SafeGraph Places tracks 80 million plus verified points of interest across 900 plus categories, updated monthly, so a competitor that opened last month actually shows up on the map instead of leaving a blind spot in the analysis.
2. Competitive Intelligence
Knowing where competitors are located is only half the picture. The more useful question is where their customers are actually going, and whether two brands are truly competing for the same shoppers.
SafeGraph’s Starbucks vs. Dunkin’ predominance map is a real example of this kind of visualization. Instead of guessing which chain dominates a neighborhood, the map shows brand predominance block by block, using verified location and category data from SafeGraph Places.
This kind of mapping also underpins classic retail gravitation models. Reilly’s law and the Huff gravity model both use store size and distance to estimate which of two competing locations a customer is more likely to choose, and how much of the trade area a competitor is realistically pulling away.
3. Local Demand and Trends
Trade areas are not static. A neighborhood’s spending power, the categories it shops for, and which industries are expanding there shift from year to year, and an analysis based on a single snapshot in time misses this.
2026 gives a clear example. Quick service restaurants grew US sales to 419 billion dollars in 2025, up 4.8% year over year, but growth is not even. The Southwest is projected to see the fastest expansion in 2026, at 2.5% year over year, led by Texas, Florida, and Georgia. A brand planning its next 20 locations off national averages alone would miss that regional split entirely.
Category level POI data from SafeGraph, tagged across 900 plus categories, lets analysts track which categories are gaining or losing share locally rather than relying on national trend reports that may not reflect reality on the ground.
4. Personalized Marketing and Merchandising
Once a location is open, trade area analysis shifts from a one time decision to an ongoing input for marketing and merchandising. Knowing a trade area skews toward home improvement shoppers, young families, or frequent takeout diners changes what goes near the entrance, what promotions get sent out, and which categories get more shelf space.
This depends on rich place attributes, not just coordinates. SafeGraph Places includes brand affiliation, category tags, and business attributes for millions of locations, which analysts overlay with demographic data to profile who is actually shopping in a trade area. The SafeGraph category tags visualization shows how granular this gets, well beyond a generic retail label.
The payoff is direct: campaigns and store layouts built around the actual trade area profile, instead of a company wide assumption applied to every location regardless of what the local data shows.
5. Supply Chain and Inventory Planning
Trade area analysis also feeds decisions that never touch a storefront: how much inventory to stock, when to schedule deliveries, and which routes to prioritize as nearby businesses open and close. Opened and closed date tracking is one of the more underused parts of POI data here: SafeGraph Places flags when a location appears or disappears from its monthly pipeline, so a team can see a competitor’s hub close, or a complementary business open next door, and adjust before it shows up in sales numbers.
This is not a hypothetical capability. In its June 2026 release notes, SafeGraph reported flagging 1,930 brands with at least one store closure and 2,130 brands with at least one store opening in April 2026 alone, tracked directly from Places metadata on a one month delay. That kind of granular, brand level open and close signal, published monthly and in the open, is exactly the input inventory and supply planning teams need to react to a changing trade area before it shows up as a revenue miss.
6. Expansion Planning
Expansion planning is where trade area analysis moves from evaluating a single site to sequencing dozens of them. The question is not just whether a location is good, but which market to enter first, and which locations will cannibalize each other if a brand moves too fast.
This is where catchment mapping earns its keep. SafeGraph’s Austin neighborhood catchment areas visualization shows how real trade areas can be far smaller and more irregular than a simple radius suggests. Reilly’s breakpoint formula, covered in SafeGraph’s real estate site selection guide, gives analysts a way to check whether a new location sits far enough from an existing one to avoid splitting the same customer base.
With the International Franchise Association projecting a modest 0.5% unit growth rate for QSR franchises in 2026, to roughly 281,000 units, brands cannot afford to expand into markets that cannibalize existing locations. Sequencing, not just site quality, is now part of the analysis.
7. Urban Planning
Trade area analysis is not only a retail tool. Municipalities and urban planners use the same underlying data, POI density, accessibility, and demographic overlays, to identify where a community is underserved and where infrastructure dollars should go.
SafeGraph’s grocery store access visualization is a direct example: mapping grocery store density against population data surfaces food deserts the same way a retailer would surface a whitespace market, using building footprint data to gauge the scale and accessibility of existing locations. A planning department can use this to prioritize a transit line, a market incentive, or a zoning change where it is needed most. This is where trade area analysis and urban planning genuinely converge: the same POI and geometry data that tells a retailer where to open a store tells a city where a store is missing.
How Data Quality Shapes These Benefits
Every benefit above depends on one thing: whether the underlying location data is accurate and current. A trade area analysis built on stale POI data will confidently recommend a site next to a competitor that closed eight months ago, or miss a new entrant that already captured the trade area’s demand.
This is SafeGraph’s core differentiator. SafeGraph Places covers 80 million plus verified points of interest across 15,000 plus brands and 900 plus categories, refreshed monthly rather than the quarterly or biannual cycle common among other providers, with opened and closed dates tracked at the source level. SafeGraph also publishes this transparently: its June 2026 release notes report 77,855,808 total POIs alongside brand level open and close counts, updated every month rather than held back as an internal metric, a level of transparency rare among POI vendors.
Location accuracy matters just as much as coverage. SafeGraph Geometry adds machine verified building footprints, reducing the attribution errors that come from treating every location as a single point on a map. For teams validating addresses across a store network, SafeGraph Address rounds out the picture with structured, global address data.
Better inputs do not guarantee better decisions, but they remove the guesswork that made trade area analysis unreliable.
Benefits of Trade Area Analysis by Industry
The seven benefits above play out differently depending on the industry running the analysis.
Retail and grocery teams lean hardest on competitive intelligence and merchandising, using trade area data to decide store size, layout, and which products to prioritize by location.
Quick service restaurants lean on expansion sequencing and demand tracking, especially as digital orders now account for 42% of QSR sales, up from 15% in 2019.
Commercial real estate teams, covered in SafeGraph’s real estate site selection guide, use trade area data to match tenants to properties and assess a shopping center’s true customer base before acquisition.
Finance and investment teams apply site deselection logic to evaluate loan risk and portfolio exposure, especially during periods of elevated closures like 2025’s net loss of roughly 3,000 US stores.
Municipal and civic planners use trade area analysis for the urban planning case above: identifying service gaps and justifying infrastructure investment with the same POI and demographic data retailers use to pick a store site.
Closing Thought
Trade area analysis has always been about reducing guesswork, but the stakes have changed. With roughly 3,000 more US stores closing than opening in 2025, and SafeGraph’s own data showing more than 4,000 brands opening or closing at least one location in a single recent month, businesses treating trade area analysis as a one time exercise before signing a lease are already behind. The ones treating it as a living, monthly habit, backed by data that updates as fast as the market, are the ones deciding where the next store, restaurant, or public service belongs.
Ready to Run Your Own Trade Area Analysis?
The seven benefits above only hold up if the data behind them is accurate and current. Schedule a demo to see how SafeGraph Places data can support your next site selection, expansion, or deselection decision.
Related reading: