Every time a shopper visits a store, a delivery truck navigates a route, or a consumer taps an app, a digital footprint is created. Location intelligence (LI) is the discipline of turning those billions of daily signals into structured, actionable business insight.
From retail chains optimizing their store networks to insurers pricing risk by geography and healthcare systems planning clinic locations, location intelligence is now a foundational capability for data-driven organizations across every industry.
This guide covers everything you need to know: what LI is, how it works under the hood, who uses it, the 10 most valuable use cases, how to navigate data privacy, how to evaluate providers, and how to get started, whether you are an analyst, a product manager, or an executive making a platform investment decision.
Key stat: The global location intelligence market was valued at $17.6 billion in 2024 and is projected to reach $35.2 billion by 2029, growing at a CAGR of 14.9% (MarketsandMarkets, 2025).
What Is Location Intelligence?
Location intelligence is the process of deriving meaningful business insights from geospatial data, information that has a geographic component such as coordinates, addresses, boundaries, or movement patterns. It combines the power of mapping, spatial analysis, and business analytics into a single workflow that answers questions traditional BI tools cannot: not just what happened, but where it happened and why geography matters.
The concept is not new. In 1854, physician John Snow mapped cholera deaths in London street by street, discovering that a contaminated water pump was the source of the outbreak. That spatial reasoning, layering geography onto a business problem to reveal patterns invisible in rows and columns is the essence of location intelligence, even if today’s tools operate at planetary scale and millisecond speed.
Modern location intelligence platforms ingest data from dozens of sources simultaneously: mobile devices, satellite imagery, point-of-interest (POI) databases, census records, transaction data, and deliver insights through APIs, dashboards, and data feeds that plug directly into existing business workflows.
In short: if business intelligence answers ‘what and how much’, location intelligence answers ‘where, why there, and what does proximity mean for outcomes’.
Location Intelligence Vs. Gis Vs. Geospatial Analytics Vs. Business Intelligence
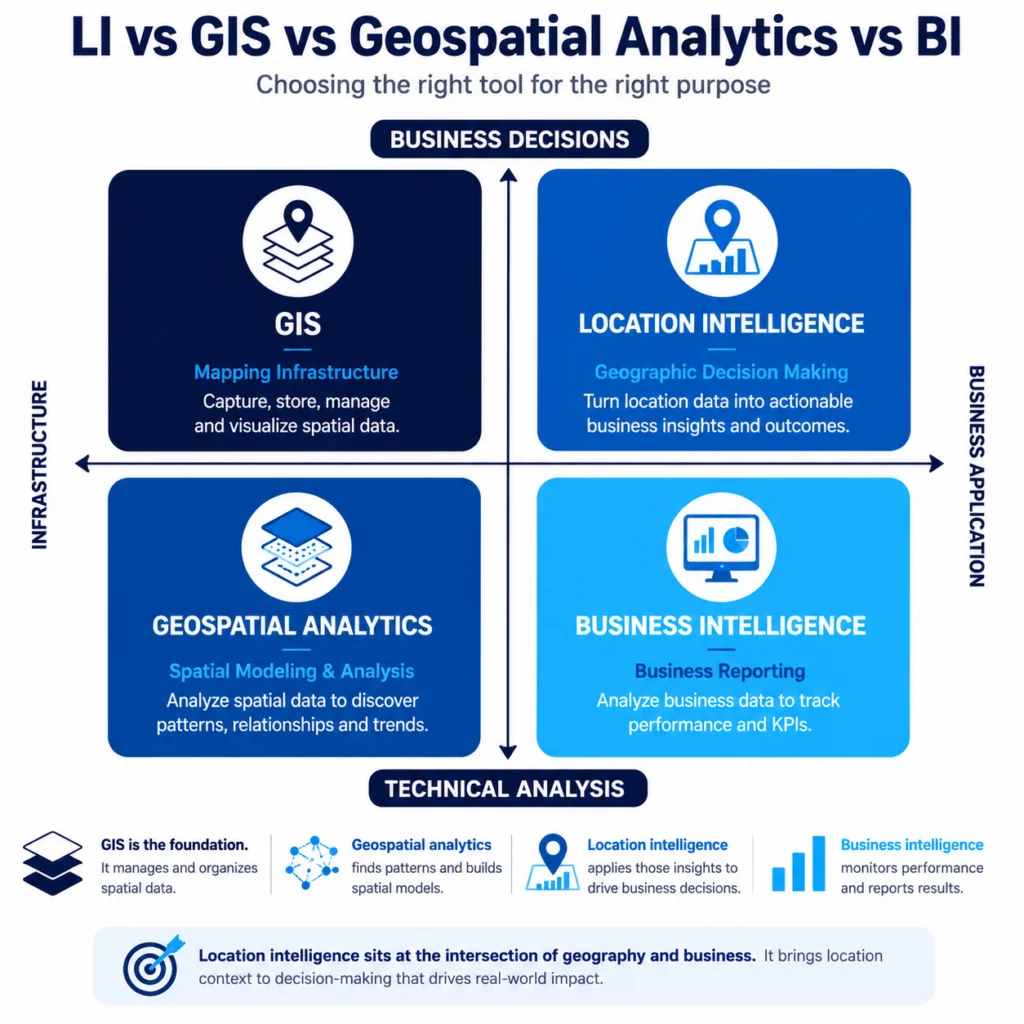
These terms are frequently confused, even by practitioners. Here is a precise comparison:
Dimension | Location Intelligence | GIS | Geospatial Analytics | Business Intelligence |
|---|---|---|---|---|
Definition | Business insights derived from geographic data | System for capturing, storing, and displaying spatial data | Statistical analysis of spatial datasets | Insights from structured enterprise data (sales, operations) |
Primary data type | POI, mobility, census, satellite | Shapefiles, rasters, vector layers | Spatial datasets, remote sensing | ERP, CRM, financial data |
Primary user | Business analyst, product team, executive | Cartographer, urban planner, GIS specialist | Data scientist, researcher | Finance, operations, sales teams |
Key tools | SafeGraph, Placer.ai, CARTO | Esri ArcGIS, QGIS, MapInfo | R (sf), Python (GeoPandas), PostGIS | Tableau, Power BI, Looker |
Typical output | Heatmaps, trade area reports, visit trends | Maps, spatial databases, layer overlays | Cluster models, predictive spatial models | Dashboards, reports, KPI scorecards |
Business focus | High – built for decision-making | Low – infrastructure tool | Medium – analytical, not prescriptive | High – but geography-blind |
When to use LI vs. GIS
Use GIS when you need a foundational mapping infrastructure, for example, managing a utility network or maintaining a municipal land registry. GIS is the database; location intelligence is the insight layer built on top of it.
Use location intelligence when you need to answer a business question with a geographic dimension: Which site should we open next? Which customers are at risk of churning because a competitor opened nearby? Which zip codes show the highest foot traffic for our target demographic?
How Does Location Intelligence Work?
Location intelligence is not a single technology, it is a five-stage data pipeline that transforms raw geographic signals into structured business insight. Understanding each stage helps you evaluate data providers and build systems that are both accurate and compliant.
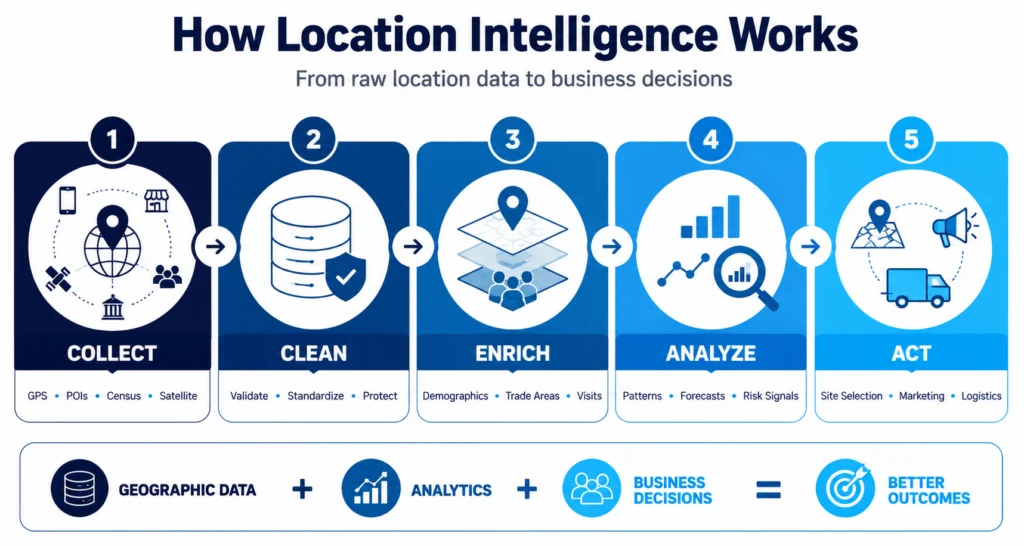
Stage 1: Data Collection
Raw location data comes from multiple source types that are often combined to improve accuracy and coverage:
- Mobile device signals: GPS pings and cell tower triangulation data collected (with consent) through mobile apps and SDKs, the most granular and scalable source of human mobility data
- Point-of-interest (POI) databases: Structured records of physical places: stores, restaurants, offices, parks, including name, category, address, hours, and polygon boundary
- Satellite and aerial imagery: Used for land use classification, building detection, and change detection at scale
- Census and administrative data: Population counts, demographics, income, and household data from government sources like the US Census Bureau ACS
- Transaction and sensor data: Retail POS systems, traffic sensors, smart city infrastructure
Stage 2: Normalization and Cleaning
Raw location data is notoriously messy. GPS signals bounce off buildings (“urban canyon” errors), mobile SDK data varies in quality across providers, and POI records go stale as businesses open and close. Normalization involves:
- Filtering out improbable signals (e.g., a device appearing in two cities within one minute)
- Standardizing address formats, coordinate systems, and category taxonomies
- Deduplicating POI records across data sources
- Applying privacy filters, removing or aggregating data that could identify individuals
This is where data provider quality diverges dramatically. SafeGraph’s Places dataset, for example, undergoes continuous accuracy monitoring against ground-truth sources to maintain POI accuracy above 95%.
Stage 3: Enrichment and Aggregation
Cleaned data is enriched by layering additional context:
- Demographic enrichment: Appending census population, income, and household composition data to geographic areas
- Visit pattern aggregation: Aggregating device signals into anonymized visit counts per POI per time period
- Trade area modeling: Using actual visitor origin data to define the realistic catchment area of a location
- Building footprint overlay: Mapping visit signals to precise building polygons rather than street addresses
Stage 4: Analysis
Enriched datasets are analyzed using spatial queries and, increasingly, machine learning models:
- Spatial joins: Intersecting two geographic datasets (e.g., ‘which of our customers live within 5 miles of a competitor location?’)
- Clustering: Identifying geographic concentrations of high-value customers or high-risk properties
- Predictive modeling: Using historical visit patterns to forecast future traffic, sales lift, or churn risk
- Anomaly detection: Flagging unusual patterns, e.g., a sudden drop in foot traffic at a store before the company reports earnings
Stage 5: Visualization and Delivery
Insights are delivered through:
- Interactive maps and dashboards (CARTO, Kepler.gl, Google Data Studio with BigQuery integration)
- API feeds that pipe data directly into existing BI tools, CRMs, or custom applications
- Exported datasets (CSV, GeoJSON, Parquet) for data science teams
- Embedded widgets for SaaS products that surface LI insights to end users
The role of AI in modern location intelligence
AI integration: Machine learning now enhances every stage of the LI pipeline. At collection, ML models filter GPS noise. At enrichment, natural language processing extracts POI attributes from unstructured sources. At analysis, deep learning models predict visit likelihood, site performance, and demographic shift with accuracy that rule-based approaches cannot match. |
Who Uses Location Intelligence?
Location intelligence is used by organizations across industries wherever geographic context improves decisions. The primary users are:
Industry | Primary LI use | Key question answered |
|---|---|---|
Retail & CPG | Site selection, trade area analysis, competitive benchmarking | Where should our next store be, and what sales volume should we expect? |
Real estate | Property valuation, market analysis, demand forecasting | What is the fair value of this asset, given its location context? |
Insurance | Risk pricing, catastrophe modeling, fraud detection | What is the actual loss exposure for this address or region? |
Financial services | Credit risk, market sizing, branch network optimization | Which geographies represent underserved opportunity? |
Healthcare | Clinic siting, patient access analysis, disease surveillance | Where do we need more care capacity relative to patient demand? |
Logistics & supply chain | Route optimization, last-mile planning, network design | How do we minimize cost and delivery time across our territory? |
Government & urban planning | Infrastructure planning, emergency response, zoning | Where should we invest public resources for maximum impact? |
Advertising & media | Audience targeting, attribution, out-of-home planning | Did this campaign drive incremental store visits? |
Technology | Product personalization, LBS features, fraud signals | How do we make our product smarter with location context? |
Location Intelligence Use Cases
Below are the 10 most commercially significant location intelligence use cases, with a focus on practical application and measurable outcomes.
1. Retail site selection
Site selection is the original and still the most financially consequential LI use case. Opening a store in the wrong location can cost millions; choosing the right one can generate outsized returns for decades.
LI-powered site selection combines trade area analysis (mapping where existing customers actually come from), competitive density (how many comparable stores operate within the catchment), demographic fit (does the local population match the brand’s target profile), and visit velocity benchmarks (what foot traffic volume predicts required sales for profitability).
Retailers using SafeGraph Places reduce site selection cycle time from 6–12 months of manual market research to 4–6 weeks of data-driven analysis.
2. Trade area analysis
A trade area is the geographic zone from which a business draws most of its customers. Traditional trade area models used simple radius rings (1 mile, 3 miles, 5 miles). Modern LI replaces these with actual visitor origin data derived from anonymized device signals, producing isochrone-based or gravity-model trade areas that reflect real customer behavior.
Accurate trade area definition changes how brands allocate marketing spend, plan new locations, and model cannibalization risk when adding stores to an existing network.
3. Competitive intelligence
Location intelligence enables businesses to measure competitor performance with the same objective data they use to measure their own. By analyzing visit patterns to competitor locations: traffic volume, peak hours, customer cross-shopping behavior, brands can identify competitor weaknesses, benchmark their own performance, and time marketing campaigns to exploit competitive gaps.
4. Visit attribution for advertising
Visit attribution answers the question: did this advertising campaign actually drive people to our physical location? By matching anonymized device IDs that were exposed to a digital ad with the same devices later appearing at a store, advertisers can calculate the incremental store visits generated by a campaign and compute a true cost-per-visit metric alongside traditional digital metrics.
This is particularly valuable for out-of-home advertising like billboards, transit ads, digital screens, where measurement has historically been opaque. Clear Channel, a SafeGraph customer, uses visit attribution data to demonstrate campaign performance to advertisers across its OOH inventory.
5. Insurance risk modeling
Property and casualty insurers use location intelligence to price risk with precision that actuarial tables alone cannot achieve. By layering flood zone maps, wildfire risk models, crime data, building age and construction quality, and proximity to fire stations onto a given address, insurers can price individual policies more accurately and model portfolio-level catastrophe exposure.
LI also improves fraud detections, for example, flagging a claim for storm damage at a property that LI shows experienced no severe weather event within its geographic area.
6. Supply chain and logistics optimization
Last-mile delivery is the most expensive segment of the supply chain, accounting for up to 53% of total shipping costs (Capgemini Research Institute, 2019). Location intelligence improves last-mile efficiency through dynamic routing (adjusting delivery sequences in real time based on traffic and access constraints), territory design (balancing delivery volumes across driver territories), and network design (positioning distribution centers relative to actual demand density).
7. Real estate market analysis
Commercial real estate investment decisions are inherently geographic. LI enables investors, developers, and brokers to evaluate properties on dimensions beyond square footage and cap rate: foot traffic trends, neighborhood trajectory (is the area growing or declining?), anchor tenant health, and demographic shift. These signals predict property performance with greater accuracy than lagging financial indicators.
8. Urban planning and public infrastructure
City and county planners use LI to make evidence-based decisions about where to build roads, transit routes, parks, and public facilities. By analyzing movement patterns across a city, planners can identify underserved areas, model the impact of proposed infrastructure changes, and optimize emergency service coverage. The US Census Bureau’s American Community Survey, combined with mobility data, has become a standard input for federal infrastructure grant applications.
9. Healthcare access and facility planning
Healthcare organizations use LI to ensure that care capacity is matched to population needs geographically. Hospital systems analyze the travel time from patient zip codes to existing facilities to identify coverage gaps. Public health agencies map disease incidence against demographic and environmental data to target intervention resources. Urgent care chains use LI-driven site selection to maximize patient access within their target service area.
10. Financial services and market expansion
Banks, credit unions, and fintech companies use location intelligence to identify underbanked markets, optimize branch and ATM networks, and assess credit risk with geographic context. By analyzing the physical retail environment around a borrower’s address, the density of employers, the health of local businesses, the trend in foot traffic lenders can supplement traditional credit scores with environmental risk signals that improve both approval rates and default prediction accuracy.
Location Data Privacy And Compliance
Location data is among the most sensitive personal data categories recognized by privacy law. A precise GPS trail can reveal where someone worships, receives medical care, attends political meetings, or sleeps at night. Enterprise buyers have both a legal obligation and a reputational interest in ensuring that the location intelligence data they use was collected, processed, and delivered in a privacy-compliant manner.
What makes location data sensitive
Under the California Consumer Privacy Act (CCPA) and the EU General Data Protection Regulation (GDPR), precise geolocation data is classified as sensitive personal information that requires explicit consumer consent to collect and use. Even aggregate or anonymized location datasets must meet technical standards for privacy protection, simple removal of a name is not sufficient if the remaining data can be re-identified.
The difference between raw GPS data and privacy-safe LI
Responsible location intelligence providers do not sell raw, individual-level GPS trails. Instead, they:
- Collect data only from consumers who have provided explicit opt-in consent through compliant app SDKs
- Aggregate device-level signals into anonymized visit counts (e.g., ‘2,400 visits to this POI in March 2026’ rather than individual trip records)
- Apply k-anonymity and differential privacy techniques to prevent re-identification of individuals from aggregate data/
- Suppress data for sensitive location categories (medical facilities, religious institutions, political organizations, schools)
Five-point privacy checklist for evaluating LI providers
- Consent: Does the provider collect data only from consumers who have explicitly opted in?
- Aggregation: Is the delivered data aggregated and anonymized, not individual-level?
- Suppression: Does the provider suppress data for sensitive location types?
- Documentation: Can the provider supply a Data Processing Agreement (DPA) and documented methodology?
- Audit trail: Does the provider maintain records sufficient for GDPR Article 30 processing register compliance?
Location Intelligence Data Providers – Comparison Table
The location intelligence data market includes providers across several distinct data categories. This table reflects the landscape as of June 2026.
Provider | Primary data type | Geographic coverage | Best for | Pricing model |
|---|---|---|---|---|
SafeGraph | POI (Places), Geometry, Address | Global | Retail analytics, site selection, academic research, app development | Subscription/ Free Samples |
Precisely (incl. former Veraset) | Address data, POI, property, demographics, mobility | Global | Enterprise data enrichment, risk modeling, master data management | Enterprise license |
Foursquare | POI, foot traffic, consumer behavior | Global | Advertising attribution, app location features | SaaS / API |
Placer.ai | Foot traffic analytics, competitive benchmarking | US | Retail and CRE market analysis, self-serve analytics | SaaS subscription |
Esri | GIS platform, census, demographic data | Global | GIS infrastructure, government, large enterprise | Platform license |
CARTO | Spatial analytics platform, data marketplace | Global | Spatial data science, cloud-native analytics | Platform SaaS |
HERE Technologies | Maps, routing, POI, real-time traffic | Global | Automotive, logistics, mapping applications | API / enterprise license |
TomTom | Maps, routing, traffic, POI | Global | Automotive navigation, fleet telematics | API / OEM license |
Google Places API | POI, reviews, real-time data | Global | Consumer app development, POI enrichment | Pay-per-use API |
Pitney Bowes (Precisely) | Address validation, geocoding, demographics | Global | Address quality, data enrichment pipelines | Enterprise license |
Dun & Bradstreet | Business location data, firmographics | Global | B2B prospecting, business address data | Enterprise subscription |
Regrid | Parcel data, land records | US | Real estate, utilities, government | Subscription |
Nearmap | High-resolution aerial imagery | US, AU, NZ, CA | Construction, insurance, urban planning | Subscription |
Maxar | Satellite imagery, geospatial analytics | Global | Defense, government, large enterprise | Enterprise contract |
DigitalBridge | Telecom tower location data | Global | Infrastructure investment, network planning | Enterprise |
OpenStreetMap | Open-source map and POI data | Global | Development, academic research, base mapping | Free / community |
US Census Bureau (ACS) | Demographics, housing, economic data | United States | Academic research, market sizing, enrichment layer | Free public data |
How To Choose A Location Intelligence Provider
With over a dozen credible providers in the market, selecting the right partner requires systematic evaluation across five dimensions:
Evaluation dimension | What to assess | Questions to ask the vendor |
|---|---|---|
Data accuracy | POI accuracy rate, visit count methodology, update frequency | What is your measured POI accuracy rate? How do you validate visit data against ground truth? |
Coverage | Geographic footprint, POI category depth, historical data availability | How many POIs do you cover in my target markets? How far back does your historical data go? |
Privacy compliance | Consent framework, aggregation methodology, DPA availability | Can you provide a signed DPA? Is your data CCPA and GDPR compliant? Do you suppress sensitive categories? |
Technical integration | API quality, data delivery format, refresh cadence | What format do you deliver data in? What is the SLA for API uptime? How often is data refreshed? |
Pricing and flexibility | Pricing model, contract terms, sample data access | Can we access a sample dataset before committing? Are there volume tiers or usage-based pricing options? |
Most enterprise buyers underweight privacy compliance during vendor evaluation, until a legal or reputational incident forces the issue. Make compliance documentation a first-round requirement, not an afterthought.
The ROI of Location Intelligence
Location intelligence investments generate returns across multiple dimensions. While ROI varies significantly by use case and organization maturity, the following benchmarks are representative of outcomes reported by enterprise LI adopters:
Use case | Typical ROI / outcome | Source / basis |
|---|---|---|
Retail site selection | 15–25% improvement in new store revenue vs. non-data-driven selection | Composite of retailer case studies, SafeGraph customer base |
Supply chain / last-mile | 10–20% reduction in delivery cost through route and territory optimization | Capgemini Research Institute, 2023 |
Insurance risk pricing | 3–8% improvement in loss ratio through LI-enriched risk models | Insurance industry benchmarks, Precisely customer outcomes |
Advertising attribution | 20–40% improvement in campaign ROI measurement accuracy | Foursquare attribution benchmarks, 2024 |
Real estate investment | 12–18% improvement in asset performance prediction accuracy | CBRE / JLL technology adoption reports |
Healthcare access planning | 25–35% reduction in facility planning cycle time | Healthcare executive survey, 2025 |
The fastest path to demonstrating LI ROI is to start with a single high-value use case, typically site selection or competitive benchmarking, where the decision impact is large and the measurement framework is straightforward.
Getting Started with Location Intelligence
If you are new to location intelligence, the following four-step framework will help you move from concept to production in the shortest possible time:
Step 1: Define your use case and success metric
Location intelligence can answer many questions, but not all at once. Start by identifying the single highest-value business question that has a geographic dimension. ‘Where should we open our next location?’ is more actionable than ‘tell us everything about our customers geographically.’ Define a success metric before you touch data: a reduction in new site failure rate, an improvement in delivery cost per package, or an increase in campaign attribution accuracy.
Step 2: Inventory your existing geographic data
Before purchasing external data, audit what you already have. Customer addresses, transaction zip codes, property locations, and delivery records are all location data that can anchor your LI workflow. Existing data also gives you a benchmark for evaluating external provider accuracy, can the provider’s POI records match your own customer location data to a known accuracy rate?
Step 3: Select a data provider and request a sample
Use the evaluation framework in Section 8 to shortlist two or three providers. Request a free sample dataset scoped to your target geography and use case. Evaluate the sample against your use case success metric: does this data actually answer your question? SafeGraph offers a free sample of Places data for both commercial evaluation and academic research.
Step 4: Build a pilot and measure before scaling
Run a time-boxed pilot of 60 to 90 days applying your LI data to one real decision. Compare the outcome against a control group or historical baseline. Document the ROI. This evidence becomes the business case for scaling the investment to additional use cases, geographies, or teams.
Conclusion
Location intelligence has moved from a specialist capability to a core business function. Organizations that embed location data into their decision-making, whether for site selection, competitive analysis, marketing measurement, or risk modeling, consistently outperform those that rely on demographic snapshots and intuition alone.
The discipline is also evolving fast. AI and machine learning are making location intelligence predictive rather than just descriptive. Real-time data pipelines are replacing monthly batch refreshes. And as the volume of available location signals grows, the competitive advantage will shift from access to interpretation: the teams that ask better spatial questions will win.
The good news is that getting started does not require a massive investment. A focused pilot, a well-scoped use case, and a reliable data provider are enough to generate meaningful insight within weeks. From there, the path to a mature location intelligence practice is a series of small expansions, each one building on the last.
The physical world generates data constantly. Location intelligence is how organizations learn to read it.