Key Takeaways
- Geocoded address data forms the foundation for reliable global location intelligence systems.
- Inconsistent address formats across regions create operational risks in mapping, delivery, and compliance.
- Standardized and verified address datasets improve accuracy across global workflows.
- Expanding address coverage in emerging markets unlocks new growth opportunities.
- Accurate address data enhances user experience, reduces costs, and strengthens fraud prevention.
Expanding into global markets takes more than ambition. It requires a solid foundation of reliable infrastructure, and at the core of that is accurate address data. In many regions around the world, clean, standardized, and geocoded addresses are difficult to find.
Across LATAM, MENA, Southeast Asia, and Eastern Europe, public records are often incomplete. Address formats vary not just from country to country, but often within countries themselves. Some regions rely on informal or local naming conventions, while others use entirely different addressing systems that apply only to specific areas. These localization challenges make it difficult to verify or normalize addresses at scale, especially when trying to support global operations with a single system.
Without a trusted source of address data, global operations run into delivery failures, compliance gaps, and poor user experiences.
In this post, we’ll show how SafeGraph solves these challenges with structured, geocoded address data – and walk through a real example from French Polynesia.
The Problem: Inconsistent Address Data Creates Real-World Risk
For many companies, expanding internationally means stitching together fragmented local data sources, manually verifying addresses, or relying on customers to input clean data – none of which scale.
Without consistent, verified address data:
- Mapping tools fail to locate addresses accurately
- Deliveries go to the wrong location or fail altogether
- Onboarding systems reject valid users due to formatting issues
- Compliance teams lack confidence in user location
The result is higher operational costs and a worse user experience in the very regions where growth matters most.
The SafeGraph Solution: Verified, Structured, and Scalable Address Data
SafeGraph provides a single source of high-quality, geocoded addresses – especially in countries where traditional providers fall short. Each address in our dataset goes through a multi-layered verification process:
- AI-powered validation: We use machine learning to detect and correct anomalies, match address strings to precise coordinates, and assess consistency across sources.
- Local signal confirmation: When applicable, we incorporate on-the-ground confirmations and various signals to verify that an address actually exists.
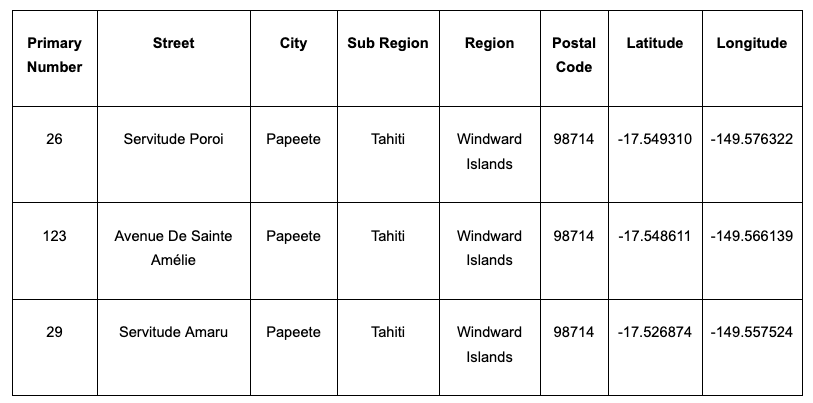
- Standardized schema: All address records follow the same structure, including fields like primary_number,street, city, region, postal_code, country, latitude, and longitude.
We continuously expand our global coverage based on customer demand – and offer custom sourcing for countries not yet supported.
Available in 25+ Countries
Our global address dataset includes support for dozens of hard-to-source countries, including:
- Turkey
- Morocco
- Israel
- Bulgaria
- Bosnia
- Georgia
- Albania
- El Salvador
We recently added support for French Polynesia, a remote and complex region that illustrates the quality and flexibility of our sourcing and are always adding more based on customer demand.
French Polynesia: A Real-World Example

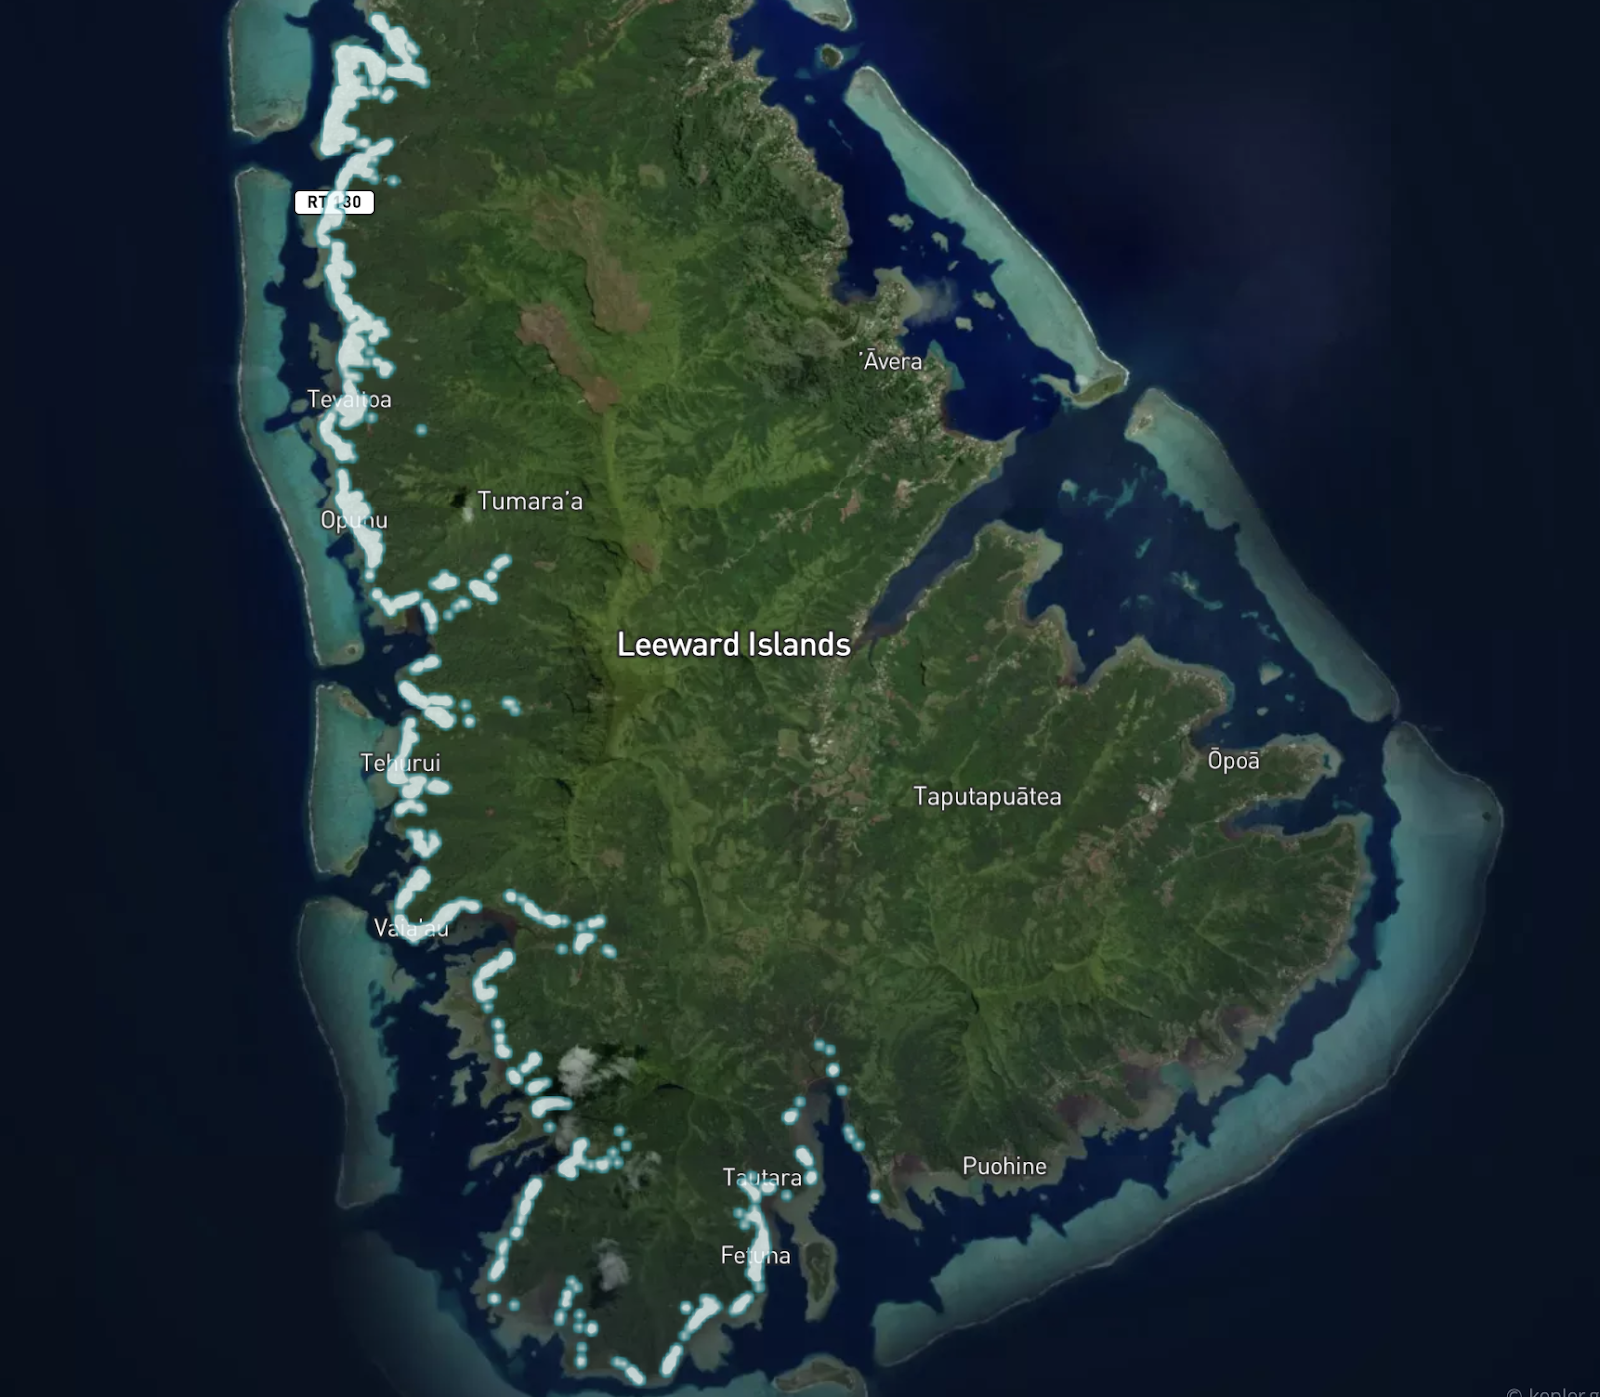
French Polynesia spans over 100 islands, many of which have no formal address systems. As a result, large parts of the country have no addresses to capture. SafeGraph provides strong coverage in the populated areas where address systems do exist, offering verified, high-precision data where it matters most.

Use Cases We Support
Teams across industries use SafeGraph’s global address data to power:
Mapping & Navigation
Search, autocomplete, and routing work best when addresses are both accurate and widely available. Poor coverage limits what users can find. By expanding address coverage in hard-to-source regions, SafeGraph increases the success rate of location-based services.
Rideshare & Delivery
Reduce failed pickups and missed deliveries by routing drivers to exact building centroids rather than vague street-level estimates. Expanding address coverage is just as critical — if an address isn’t in the database, drivers can’t be routed to it at all.
Address Verification
Normalize and validate user-submitted addresses worldwide in real time, reducing form errors and fraud risk. Broader coverage improves the success rate of verification requests, especially in regions where address data is typically incomplete or unavailable.
Shipping & Logistics
Improve delivery accuracy, reduce customer service escalations, and cut down on re-delivery costs. More precise address data also leads to better shipping quotes by enabling accurate distance and cost estimations upfront.
Fraud Detection & Market Expansion
Confirm the real-world existence of locations to fight synthetic identity fraud and assess market viability. Expanding address coverage in emerging markets makes it easier to evaluate fraud risk and identify real opportunities with greater confidence.
Example Queries
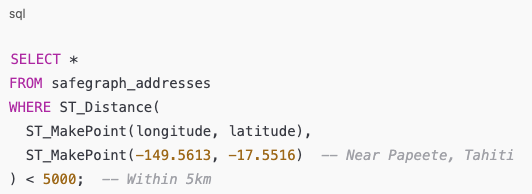
Example 1: Search for nearby addresses within a radius

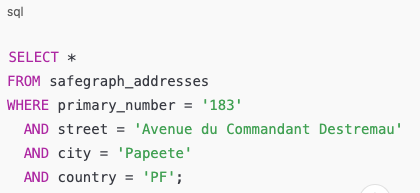
Example 2: Verify if a specific address exists

The Outcome: Launch Faster and Operate with Confidence
By using SafeGraph as your global address provider, you can:
✅ Consolidate vendors and simplify sourcing ✅ Free up internal data science and ops resources ✅ Speed up market entry and product launches ✅ Improve user experience and reduce errors ✅ Minimize fraud and compliance risk in new markets
📥 Download the Free French Polynesia Dataset
We’re offering a free sample of SafeGraph’s address data in French Polynesia. See the structure, precision, and verification quality firsthand – and test it in your own systems.
Need coverage in a different country? Let us know and we’ll prioritize it for sourcing.
Isolating businesses by location specific characteristics is an everlong industry prompt that is riddled with data access challenges. Knowing the general category of a business is a start, but it leaves much to be desired when thousands of businesses share a similar category.
A more narrow set of point of interest (POI) features are required to truly explain differences in business outcomes, customer profiles, etc. Does it offer delivery? Is it family-friendly? Can I pay in cash? These types of questions are critical across user search, real estate site selection, audience creation, and compliance.
To make these details more accessible, SafeGraph revamped its Category Tags feature and introduced Amenity Columns: a structured way to query key attributes about physical places. These updates complement our broader effort to improve location intelligence with richer category and amenity data, making it easier to filter places based on the nuances that matter. Available for all bar, restaurant, cafe, hotel, and retail trade places globally.
Why This Matters
Traditionally, many business characteristics such as “accepts reservations,” “has Wifi,” or “cocktail bar” were buried in free-text fields or inferred from inconsistent metadata, which made them difficult to analyze at scale.
SafeGraph’s POI Category Tags and Amenity Columns solve this by:
- Structuring attributes into logical columns
- Adhering to a normalized set of “reader friendly” string values
- Linked to all other contextual attributes like location name, brand, address and coordinate info, open hours, website, phone number, category, etc.
What’s Included
We’ve organized these rich attributes into eight intuitive columns:
| Column | Answers the question… | Example Values |
|---|---|---|
| category_tags | What words or phrases best describe this place, or what type of products does it sell? | Latin American Food, Mexican Food, Oaxaca Food, Tacos, Sports Bar, Cocktail Lounge, Auto Parts & Accessories |
| accessibility | Can I get there and get around? | Parking, Wheelchair Accessible Restroom |
| activities | What can I do there? | Karaoke, Pool and Billiards, Art Classes |
| amenities | What resources are available? | High Chairs, Wifi, TV, Spa, Outdoor Seating |
| owner_demographic | Who runs the business? | Women-owned, Veteran-owned |
| payment_options | How can I pay? | Accepts Cash, Accepts Credit Cards, Accepts Apple Pay |
| service_options | What kind of service is offered and how? | Accepts Reservations, Breakfast, Delivery, Drive Through, Vegan Options |
| setting | What’s the environment like? | Family Friendly, Moderate Noise, Touristy, Upscale |
All values are consistently formatted and optimized for large-scale querying.
How to Use the Data
These new features aren’t just easier to interpret; they’re designed for direct integration into your existing analytics workflow.
Whether you’re running SQL queries, training ML models, or enriching location search experiences, actionable insights are easy to extract. Below are a few real-world SQL query examples that demonstrate how to combine Category Tags and Amenity Columns to narrow on specific sets of locations:
1. Find sports bars in New York that have a TV, wifi, parking, happy hour, burgers, and accept reservations:

2. Identify cafes in California that offer bagels, delivery, have outdoor seating, and are family friendly with a casual vibe:

3. Identify Department Stores in Texas that sell perfume:

Real World POI Use Cases
Marketing & Advertising
- Build more accurate/custom location based audience segmentations
- Optimize asset selection for OOH campaigns with more precision
- Filter out sensitive locations like ‘Kid Friendly’ or ‘LGBTQ Friendly’
Maps and Generative AI Search & Discovery
- Surface relevant results from narrow, place based search queries (e.g., ‘Quiet’ cafes with ‘Outdoor Seating’ and ‘Wifi’)
- Tailor results by user preferences
- Enhance AI-search capabilities with local intent and better contextual recommendations
Retail & Real Estate
- Prioritize expansion into areas with specific demand attributes (e.g., restaurants with ‘Drive Through’ and ‘Delivery’)
- Understand competitor footprint by absence or presence of specific store attributes
- Identify gaps in service (e.g., ‘Live Music’ venues in high-density zones)
Build with Better Context
With SafeGraph’s POI Category Tags & Amenity Columns, you no longer need to guess what a location offers – you can know.
1. Explore Category Tags & Amenity Columns in our Docs Site
2. Talk to our team to learn more
FAQ’s
1. What is geocoded address data?
It is address data that has been mapped to precise geographic coordinates such as latitude and longitude.
2. Why is global address data difficult to standardize?
Different countries and regions use varying formats, naming systems, and levels of data completeness.
3. How does geocoded address data improve delivery and logistics?
It enables precise routing to exact locations, reducing failed deliveries and operational inefficiencies.
4. How is address data used in fraud detection?
It helps verify whether a location exists and supports validation of user-provided information.
5. What industries benefit from accurate address data?
Mapping, logistics, fintech, e-commerce, and mobility platforms rely heavily on accurate address datasets.