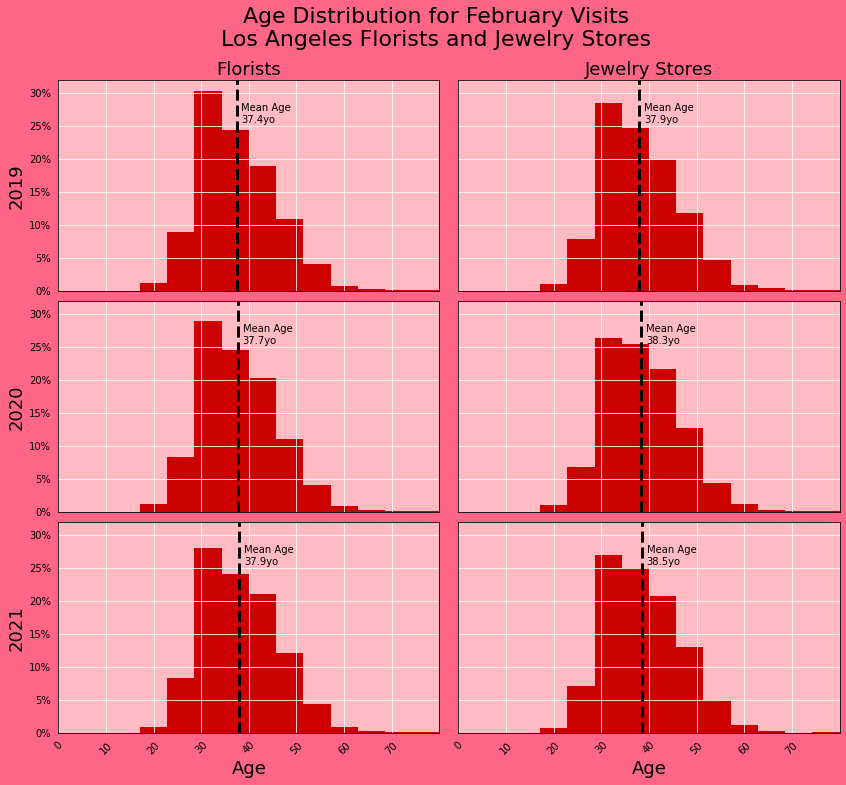
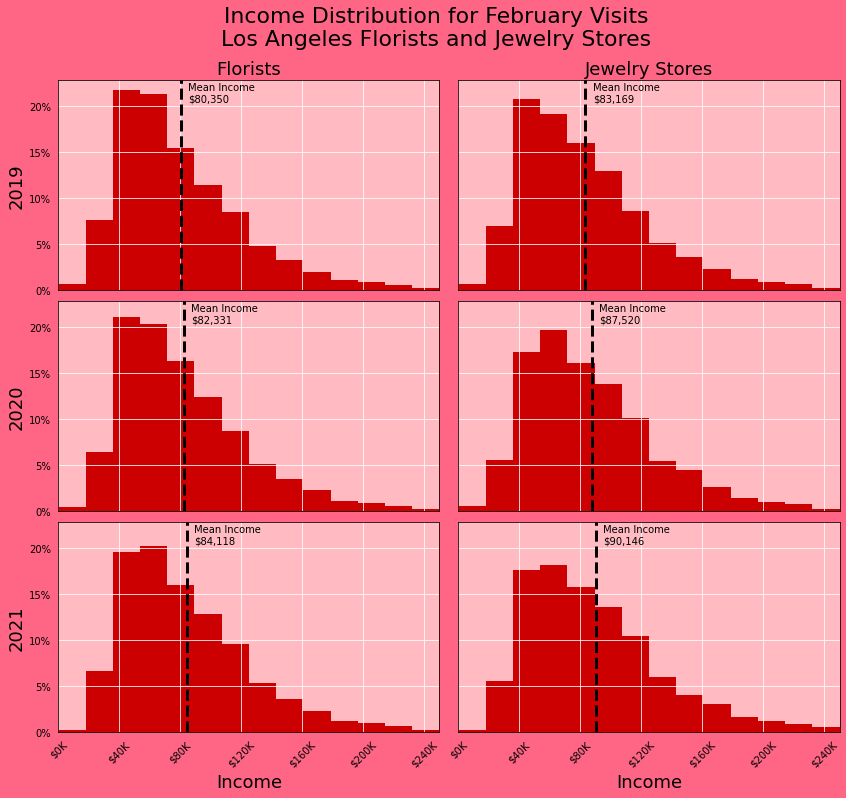
I hypothesized that jewelry stores would have older, more affluent visitors than florists in LA. To investigate, I combined SafeGraph Patterns with US Census data (median income & age by CBG) using Patterns’ visitor_home_cbgs column. I built histograms for each year (2019 vs 2020 vs 2021) and store type (florists vs jewelry stores).
Notably, the disparities between income are apparent and grew year-over-year. Furthermore, the average income for visitors at each store type increased year-over-year. The age patterns for visitors at each store type follow a similar pattern as income, but they are more subtle.
Two opportunities for future improvement come to mind that were out of the scope for this project. First, I’m curious how these distributions would compare to the area’s residents; this is answerable with Census data. Second, it’d be interesting to see how these distributions compare to other months of the year; that data isn’t part of the datathon though 
Still cleaning up the notebook from this project, but will share soon!