Hello SafeGraph community,
I have two problems about patterns data.
-
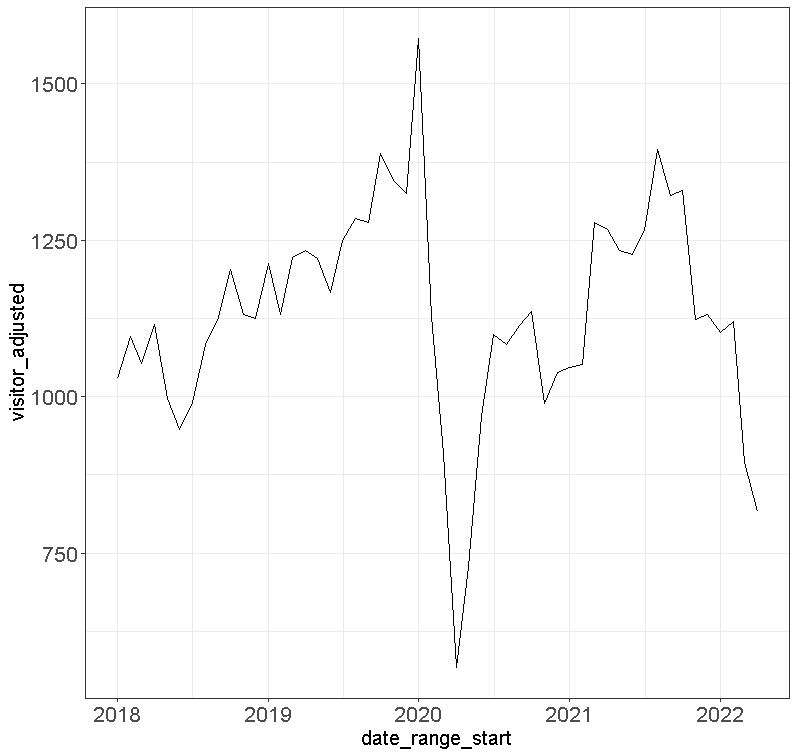
I observe a significant increase in home devices recently. As shown in the following figure, number of devices with home location CBG increases by over 50% in 2022 March. Related to this point, I find that the monthly visit to healthcare POIs (about 0.8 million) decreases significantly in this month (after normalized by CBG_population and CBG_devices_residing as suggested in SafeGraph blog). I am wondering if the decrease in visit exhibited is actually due to the abnormal increase in number of devices with home location CBG (as we need to divide visits by number_devices_residing in the normalization).
-
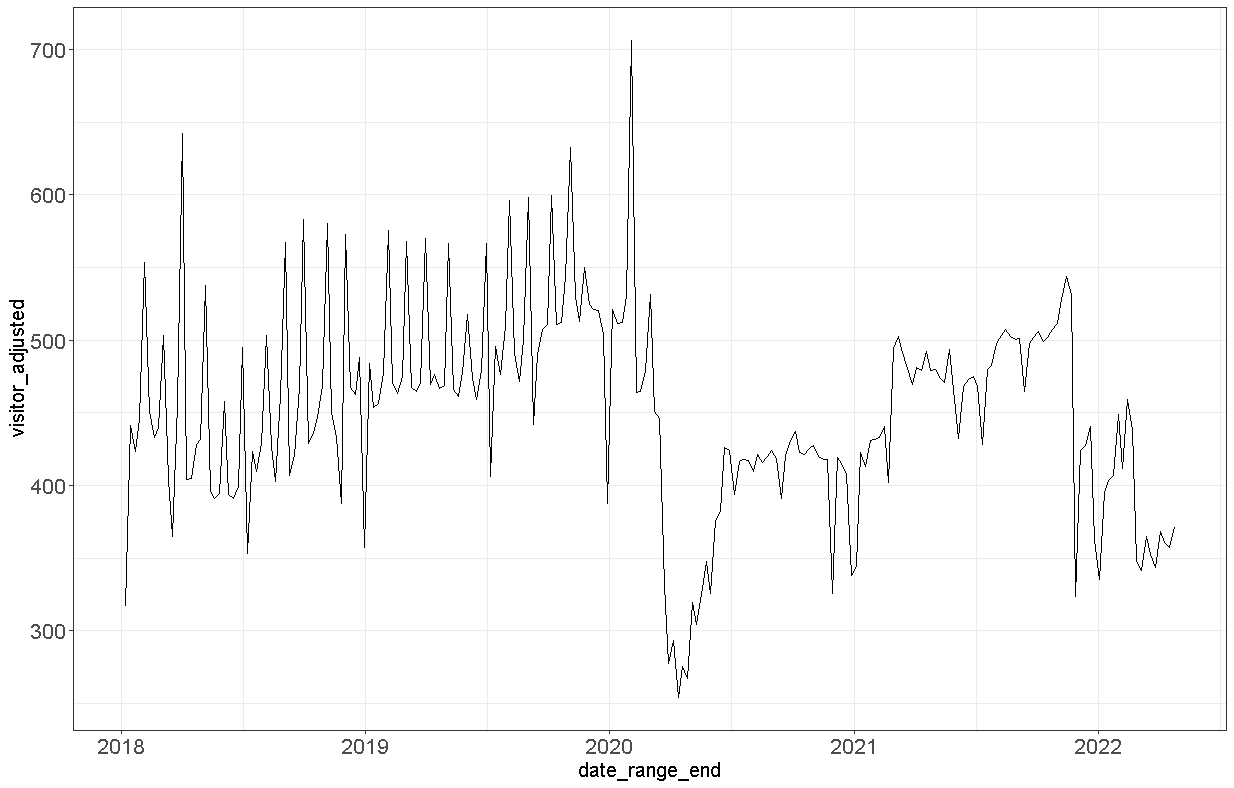
I find that the weekly pattern fluctuates heavily in 2018 and 2019, as shown below. I am not sure If any other person has reported this and will be grateful for any advice on how to handle this issue or possible reasons for the fluctuation.