Some of the most common questions we receive are focused on how we build and source our datasets. SafeGraph creates our products from a combination of machine learning, web crawling, and third-party licensing. In this blog post, we break down the sourcing process for each of our datasets.
1. Core Places
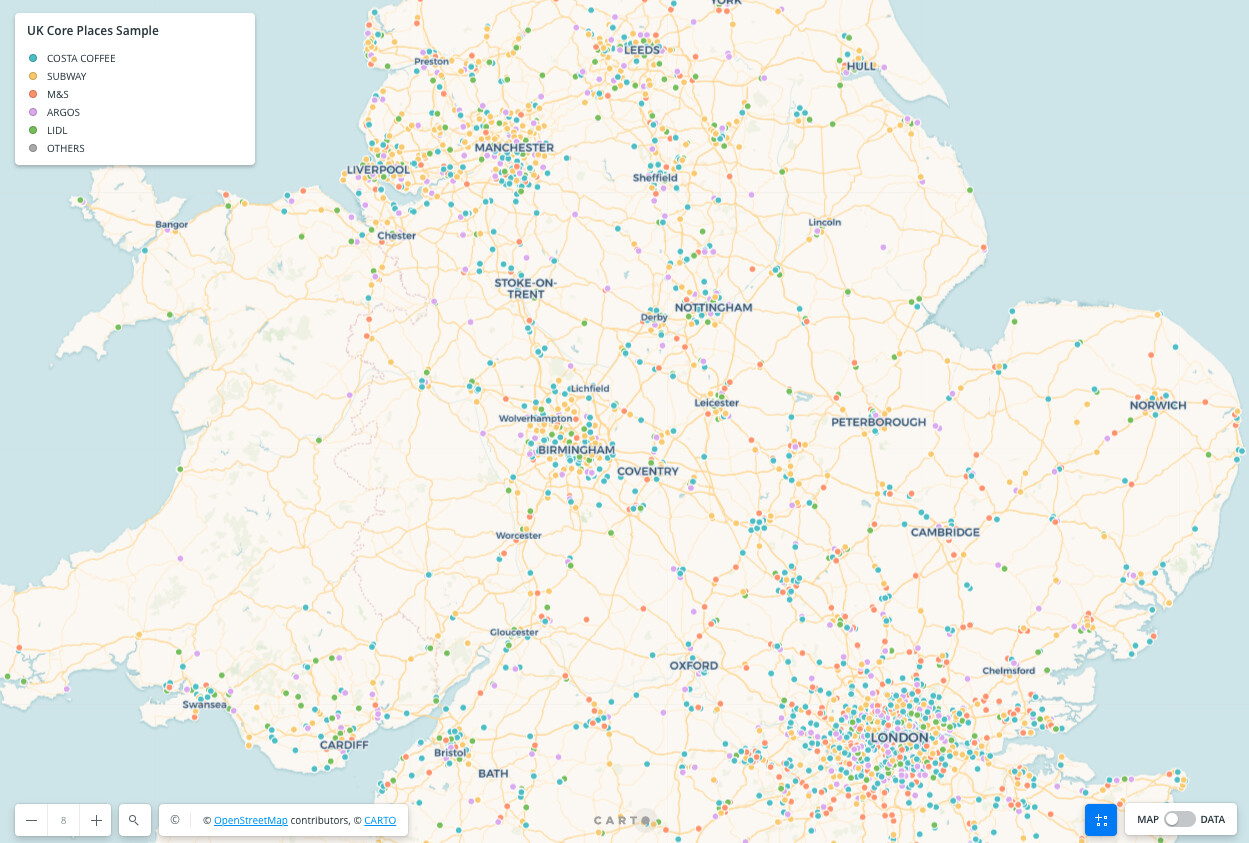
SafeGraph’s Core Places dataset provides points of interest (POI) data and detailed attribution for non-residential places. Along with the geospatial coordinates and address of the POI, we provide information like brand affiliation, open/close time, and NAICS codes for deeper context and increased analytics possibilities.
SafeGraph sources POI data in a variety of ways:
- Crawling open store locators on the web (ex. crawling a brand’s website that lists where all of its stores are)
- Using publicly available APIs and crawling open web domains that provide updated locations for a specific category of POIs (ex. websites that list where all airports are)
- Processing and modeling to infer additional attributes (ex. inferring what category a POI is)
- Licensing third-party data to fill in the gaps
Once we ingest all of this sourced data, we go through a rigorous de-duping and merging process to make sure the Core Places dataset is clean and ready for use. We also identify spatial hierarchy relationships so end-users can understand how POIs relate to one another.
2. Geometry

Building upon this POI data, SafeGraph produces our Geometry dataset, which provides building footprint polygons for POIs. As with our Core Places dataset, we source reliable third-party data and use machine learning to infer the shape of buildings from satellite imagery. Along with the geospatial coordinates, address, and brand affiliation of the POI, Geometry data provides the shape of the place of interest, formatted as Well-Known Text (WKT) for easy mapping and analysis.
SafeGraph’s Geometry dataset also includes additional attribution, such as the presence of a parking lot in the provided polygon, building height, and spatial hierarchy information. We disclose whether or not each polygon is synthetic, which indicates whether or not the polygon is inferred from machine learning.
3. Patterns
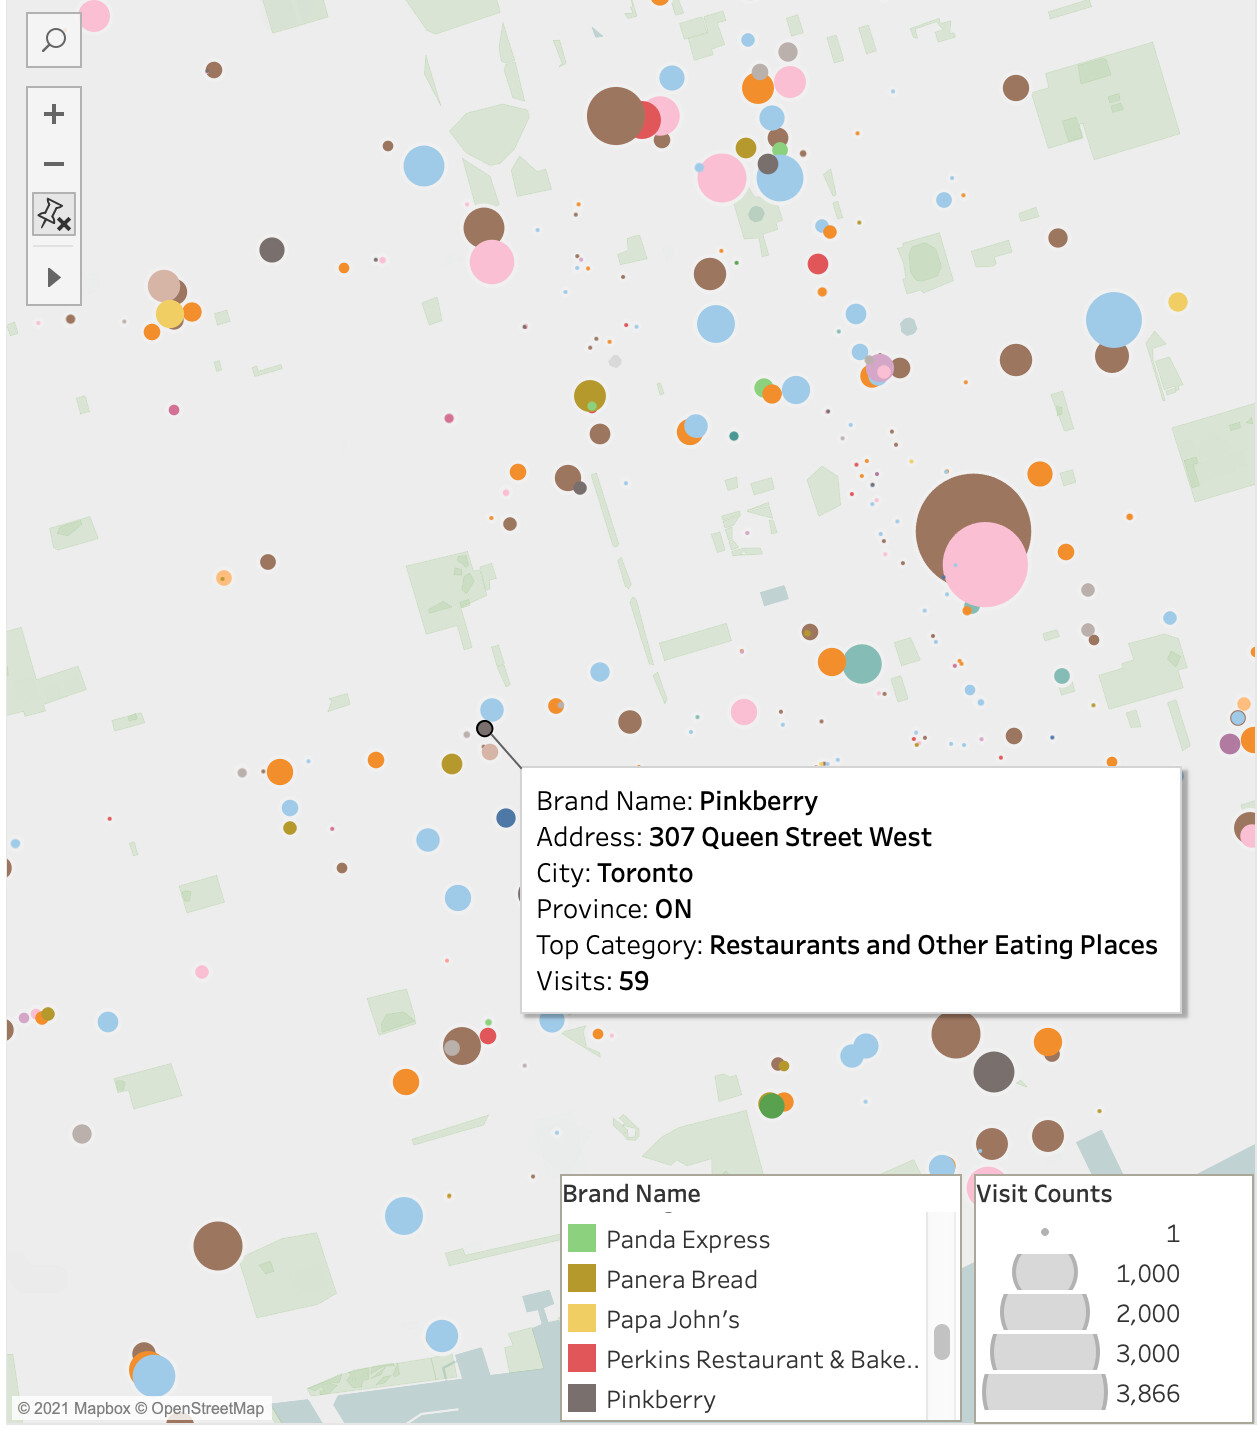
SafeGraph’s flagship foot traffic dataset, Places Patterns, provides visit counts and dwell-time data for POIs. We build this by licensing aggregated and anonymized mobility data that has been sourced from mobile applications with which users have opted-in to sharing their location. Then using our own Core Places and Geometry datasets, we derive visit attribution to specific places.
Our Patterns dataset also provides insights into where people travel from to get to the specific place, and where else they go. We aggregate origin information at the Census Block Group (CBG) level and apply differential privacy to enable analytics at an optimal geographic scale.
4. Neighborhood Patterns
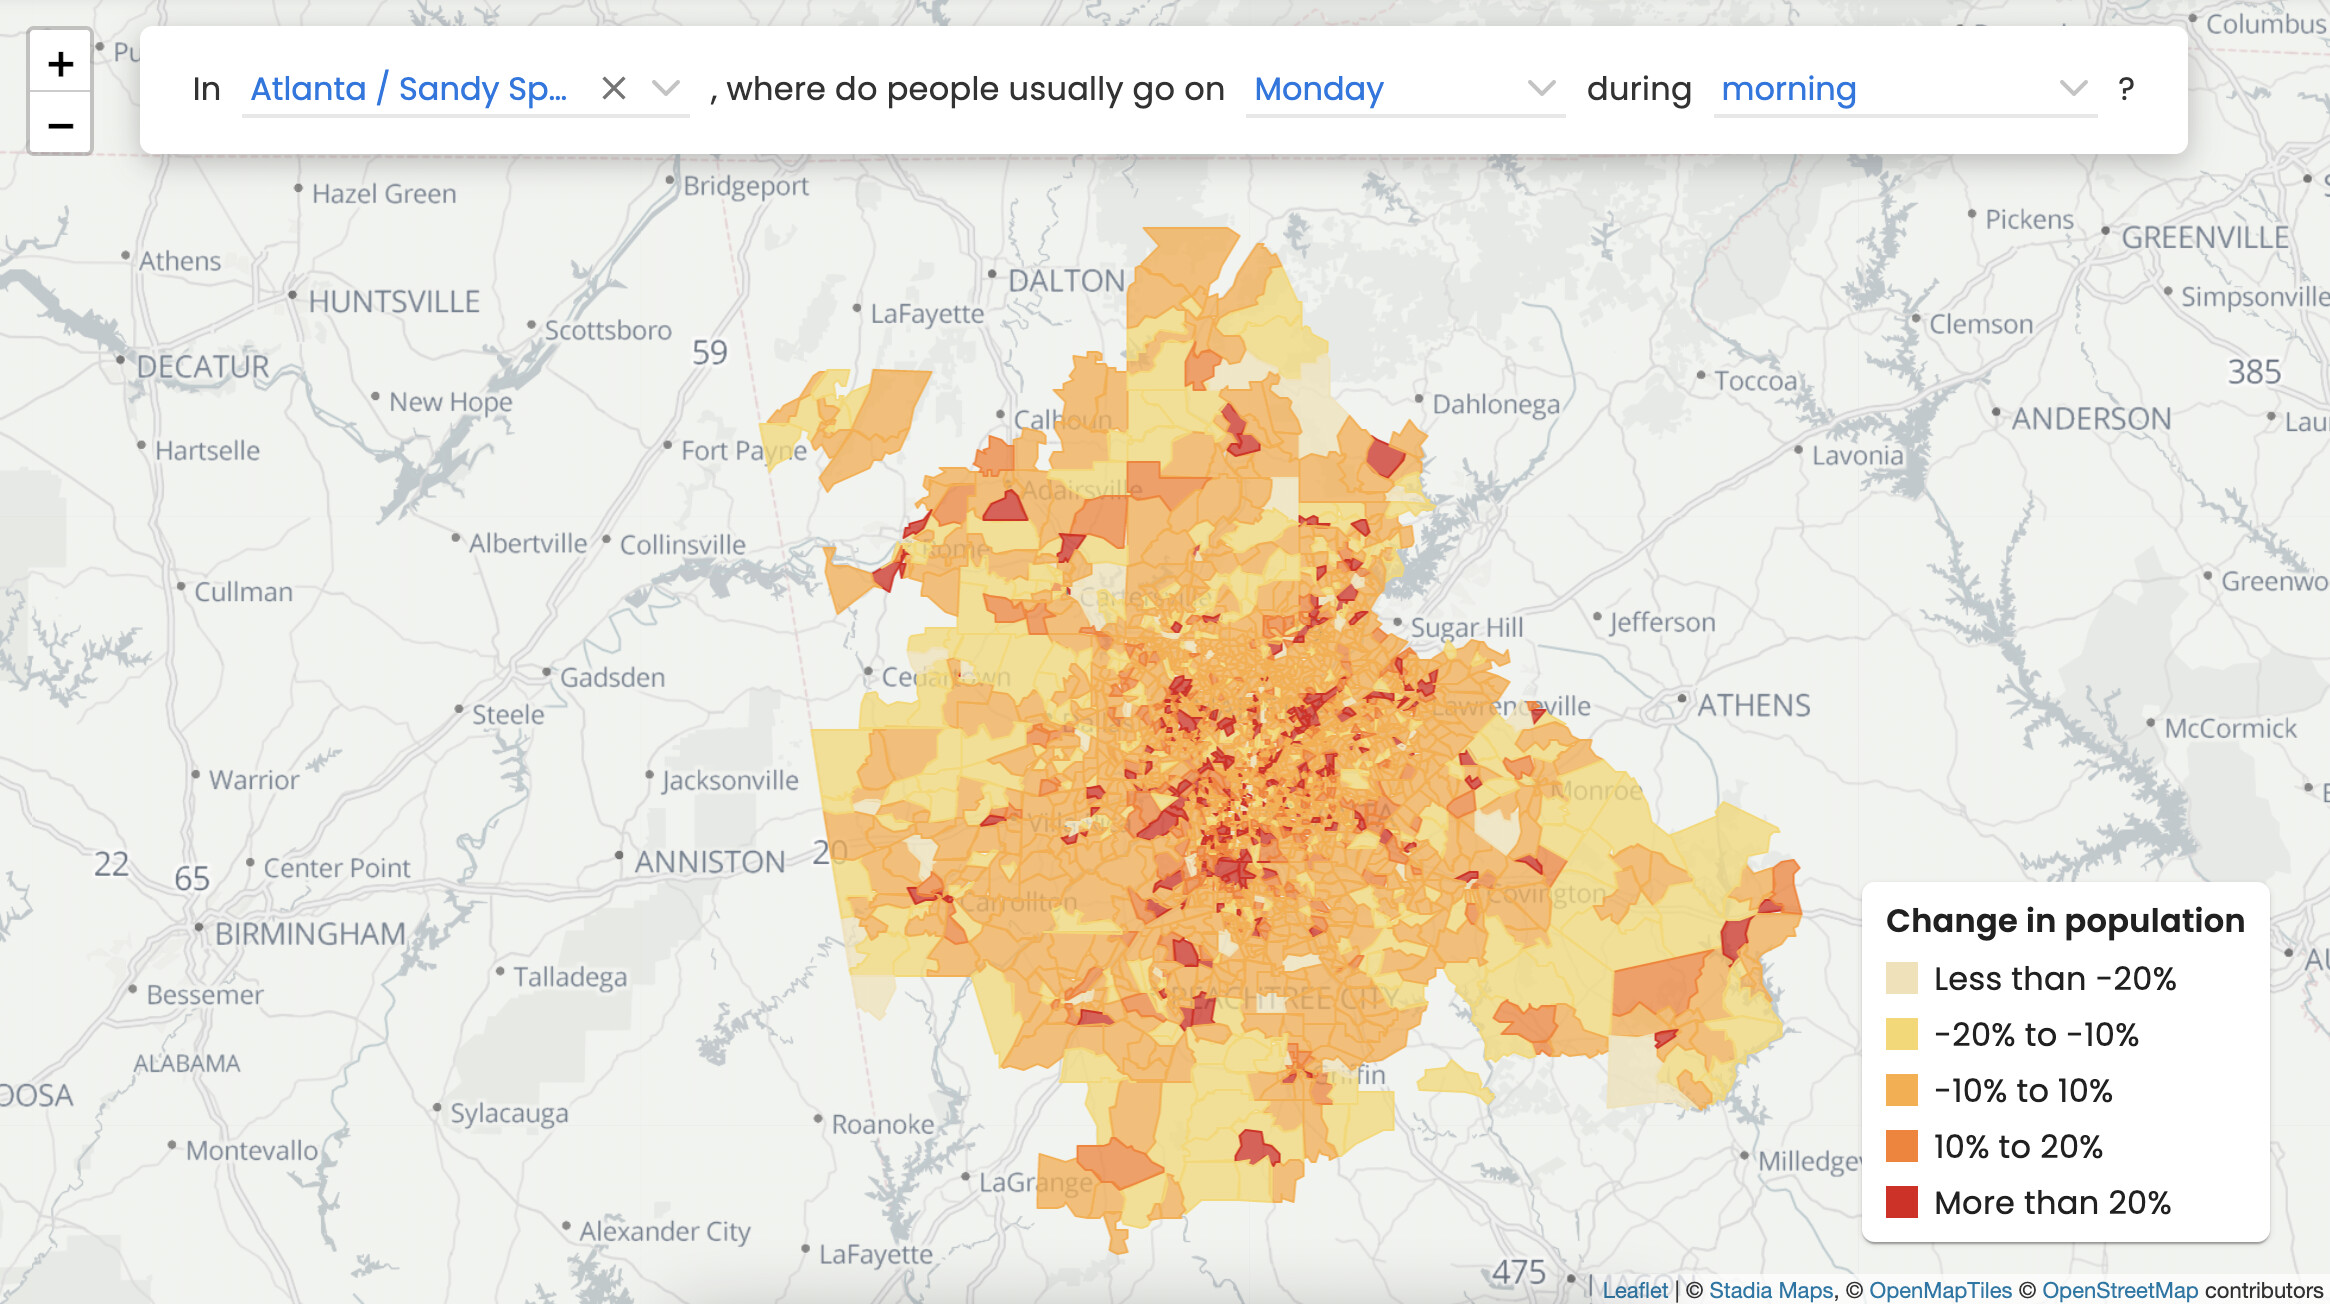
Like Places Patterns, the Neighborhood Patterns dataset delivers aggregated and anonymized mobility data sourced from third-party applications. What distinguishes the two products is the level at which SafeGraph aggregates the foot traffic counts.
Neighborhood Patterns focuses exclusively on CBG to CBG mobility, providing device counts, dwell times, and origin locations for specific timeframes. The same methodology used for visit attribution to create Places Patterns is used, but at the CBG-level. This provides more options for analyzing mobility data and can reveal larger geographic trends that are independent of POIs.