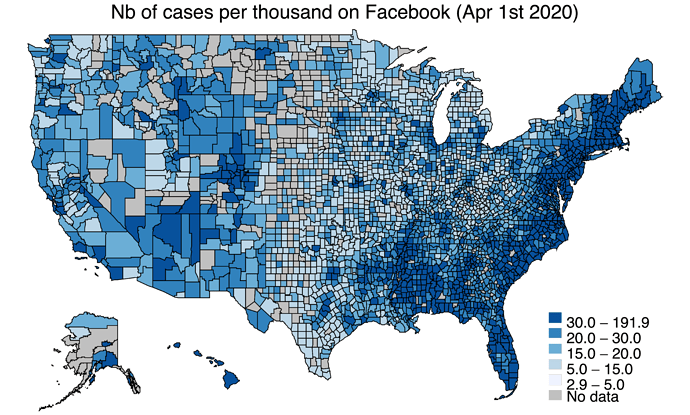
Hi, all, fascinated by all the great ideas here. Our working paper probably brings some novel aspect to it. We show that being Facebook friends with counties and countRies severely hit by the pandemic is associated with lower consumption spending. We use Facteus card transactions and Facebook social-connectedness index. Thanks @Jonathan_Chin_Facteus and @Ryan_Fox_Squire_SafeGraph for providing the data! Learning from Friends in a Pandemic: Social Networks and the Macroeconomic Response of Consumption Comments welcomed!
Hi @Tao_Wang_Johns_Hopkins_University, this is exciting work! A great example of innovation in data analysis. Here are some of my thoughts.
How does the impact of county-to-county SCI relationships from within the same state compare to the impact of those relationships between counties of different states? Although same-state county relationships were excluded in Section 3, I understand Tables 1 and 2 in Section 4.1 take them into account in columns 3 and 6. Is there any value in isolating the same-state county relationships similarly to how the different-state county relationships have been isolated in columns 1 and 4?
Figure 5 is a very cool visual! The “non-essential stores” category of consumption has a somewhat strange relationship. The logged number of COVID-19 cases in the county seems to be positively correlated vs SCI-weighted cases are negatively correlated. Any thoughts on why this might be happening? Perhaps it’s not significant because the positive correlation is so small.
As I understand, the consumption data is based on debit card spending and not at all on paper money. Is it possible people seeing more about the pandemic (locally or through social media) started using electronic payment more than previously (as opposed to paper money)? If that were the case, it seems to me that the true consumption correlations would be even more significant.
Thanks, and great work!
Additionally, I understand it’s still a working paper, but I found a couple potential minor typos:
• page 5-6 “Depending on the focus of analysis is domestic or international” might make more sense as “Depending if the focus…"
• page 7 “doest not” -> “does not”
• page 8 “we construction” -> “we constructed”
• page 10 “…information transmitted through social networks might [be] even more quantitatively significant…” is missing “be"
@Ryan_Kruse_MN_State Thanks a lot for all of these comments, particularly to your careful detection of the minor typos. To your question on our focus on the out-of-state county, we were particularly trying to avoid the confounding fact that Facebook ties are probably also geographically close. Therefore, your Facebook friends regions being badly hit might pose REAL danger to you thus affecting your decisions. Since we emphasize on the informational channel through Facebook ties, we exclude within-state ties. Actually we have used the out-of-state index throughout the paper in all specifications. As to the representativeness of debit card transactions to the total consumption spending, we have the comparison of the series with retails series measured by the Census Bureau showing a relatively reasonable correlation. Therefore, we are confident that it roughly tracks the spending dynamics regardless of the form of the transaction being paperless or in cash. All great comments you got here. We appreciate these!
@Tao_Wang_Johns_Hopkins_University Thanks for the response! I like the approach to show how debit card transactions represent the total consumption spending, thank you for clarifying.
@Tao_Wang_Johns_Hopkins_University I enjoyed reading your paper, Tao. I didn’t see any control for seasonality or lagged effects? I’d be curious how accurate your models turn out being when revenue figures are released by state tax collectors.
@Thomas_Young_Econometric_Studios_Utah_Legislature Hi, Thomas! thanks for the question. We did not control seasonal effects, because we were working on a few months of data from Feb to middle April this year. By observing the Figure 2, we informally concluded that there is typically an increase from Feb to April in spending in previous years. But we saw a drop in this year according to Figure 1. So the seasonal effects, if considered, might imply even a deeper drop. A formal seasonal adjustment requires a longer time series. Our one is too short. As the lagged effect, I am not sure what you mean. Could you clarify a little? Thanks.
